1
2
3
4
5
6
7
8
9
10
11
12
13
14
15
16
17
18
19
20
21
22
23
24
25
26
27
28
29
30
31
32
33
34
35
36
37
38
39
40
41
42
43
44
45
46
47
48
49
50
51
52
53
54
55
56
57
58
59
60
61
62
63
64
65
66
| import dash
import dash_cytoscape as cyto
import dash_html_components as html
app = dash.Dash(__name__)
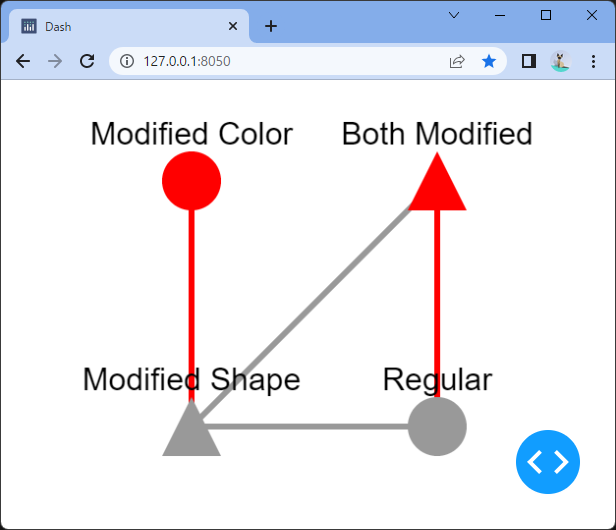
my_stylesheet = [
{
'selector': 'node',
'style': {
'content': 'data(label)'
}
},
{
'selector': '.red',
'style': {
'background-color': 'red',
'line-color': 'red'
}
},
{
'selector': '.triangle',
'style': {
'shape': 'triangle'
}
}
]
app.layout = html.Div([
cyto.Cytoscape(
id='cytoscape-elements-classes',
layout={'name': 'preset'},
style={'width': '100%', 'height': '400px'},
stylesheet=my_stylesheet,
elements=[
{
'data': {'id': 'one', 'label': 'Modified Color'},
'position': {'x': 75, 'y': 75},
'classes': 'red'
},
{
'data': {'id': 'two', 'label': 'Modified Shape'},
'position': {'x': 75, 'y': 200},
'classes': 'triangle'
},
{
'data': {'id': 'three', 'label': 'Both Modified'},
'position': {'x': 200, 'y': 75},
'classes': 'red triangle'
},
{
'data': {'id': 'four', 'label': 'Regular'},
'position': {'x': 200, 'y': 200}
},
{'data': {'source': 'one', 'target': 'two'}, 'classes': 'red'},
{'data': {'source': 'two', 'target': 'three'}},
{'data': {'source': 'three', 'target': 'four'}, 'classes': 'red'},
{'data': {'source': 'two', 'target': 'four'}},
]
)
])
if __name__ == '__main__':
app.run_server(debug=True)
|