1
2
3
4
5
6
7
8
9
10
11
12
13
14
15
16
17
18
19
20
21
22
23
24
25
26
27
28
29
30
31
32
33
34
35
36
37
38
39
40
41
42
43
44
45
46
47
48
49
50
51
52
53
54
55
56
57
58
59
60
61
62
63
64
65
66
67
68
69
70
71
72
73
74
75
76
77
78
79
80
81
82
83
84
85
86
87
88
89
90
91
92
93
94
95
96
97
98
99
100
101
102
103
104
105
106
107
108
109
110
111
112
113
114
115
116
117
118
119
120
121
122
123
124
125
126
127
128
129
130
131
132
133
134
135
136
137
138
139
140
141
142
143
144
145
146
147
148
149
150
151
152
153
154
155
156
157
158
159
160
161
162
163
164
165
166
167
168
169
170
171
172
173
174
175
176
177
178
179
180
181
182
183
184
185
186
187
188
189
190
191
192
193
194
195
196
197
198
199
200
201
202
203
204
205
206
207
208
209
210
211
212
213
214
215
216
217
218
219
220
221
222
223
224
225
226
227
228
229
230
231
232
233
234
235
236
237
238
239
240
241
242
243
244
245
246
247
248
249
250
251
252
253
254
255
256
257
258
259
260
261
262
263
264
265
266
267
268
269
270
271
272
273
274
275
276
277
278
279
280
281
282
283
284
285
286
287
288
289
290
291
292
293
294
295
296
297
298
299
300
301
302
303
|
import numpy as np
import pandas as pd
import matplotlib.pyplot as plt
import seaborn as sns
from scipy.optimize import minimize
from mpl_toolkits.mplot3d import Axes3D
from matplotlib import cm
plt.style.use('ggplot')
sns.set_palette("colorblind")
def demand_function(prices, base_demand, price_sensitivity, cross_elasticity_matrix):
"""
Calculate the demand for each product given their prices and elasticities.
Parameters:
- prices: Array of prices for each product
- base_demand: Base demand when price is at reference level
- price_sensitivity: Own-price elasticity for each product
- cross_elasticity_matrix: Matrix of cross-price elasticities
Returns:
- Array of demand values for each product
"""
demand = base_demand.copy()
for i in range(len(prices)):
demand[i] *= np.exp(-price_sensitivity[i] * prices[i])
for i in range(len(prices)):
for j in range(len(prices)):
if i != j:
demand[i] *= np.exp(cross_elasticity_matrix[i][j] * prices[j])
return demand
def profit_function(prices, base_demand, price_sensitivity, cross_elasticity_matrix, costs):
"""
Calculate the total profit across all products.
Parameters:
- prices: Array of prices for each product
- base_demand: Base demand when price is at reference level
- price_sensitivity: Own-price elasticity for each product
- cross_elasticity_matrix: Matrix of cross-price elasticities
- costs: Variable costs for each product
Returns:
- Total profit (negative for minimization algorithm)
"""
demand = demand_function(prices, base_demand, price_sensitivity, cross_elasticity_matrix)
profit = np.sum((prices - costs) * demand)
return -profit
def price_elasticity_analysis(base_price, product_index, price_range_percentage,
base_demand, price_sensitivity, cross_elasticity_matrix, costs):
"""
Analyze how profit and demand change as one product's price changes.
Parameters:
- base_price: Base prices for all products
- product_index: Index of the product to vary
- price_range_percentage: Percentage range around base price to analyze
- Other parameters as defined in previous functions
Returns:
- DataFrame with price, demand, and profit data
"""
min_price = base_price[product_index] * (1 - price_range_percentage/100)
max_price = base_price[product_index] * (1 + price_range_percentage/100)
price_points = np.linspace(min_price, max_price, 100)
results = []
for price in price_points:
current_prices = base_price.copy()
current_prices[product_index] = price
demand = demand_function(current_prices, base_demand, price_sensitivity, cross_elasticity_matrix)
profit = -profit_function(current_prices, base_demand, price_sensitivity,
cross_elasticity_matrix, costs)
results.append({
'Price': price,
'Demand': demand[product_index],
'Total Demand': np.sum(demand),
'Profit': profit
})
return pd.DataFrame(results)
num_products = 3
initial_prices = np.array([10.0, 25.0, 50.0])
base_demand = np.array([5000, 2000, 1000])
costs = np.array([2.0, 5.0, 10.0])
price_sensitivity = np.array([0.15, 0.1, 0.05])
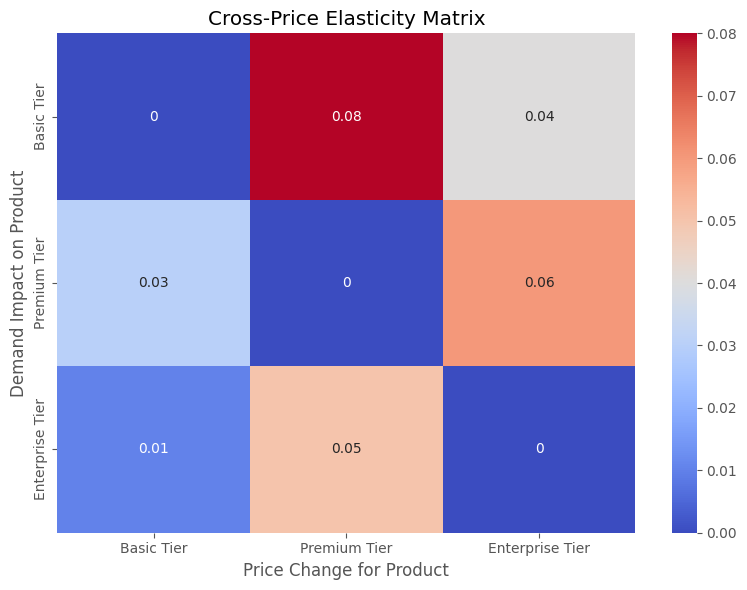
cross_elasticity_matrix = np.array([
[0.0, 0.08, 0.04],
[0.03, 0.0, 0.06],
[0.01, 0.05, 0.0]
])
result = minimize(
profit_function,
initial_prices,
args=(base_demand, price_sensitivity, cross_elasticity_matrix, costs),
method='SLSQP',
bounds=[(cost*1.1, cost*10) for cost in costs],
options={'disp': True}
)
optimal_prices = result.x
print(f"Optimal prices: {optimal_prices}")
optimal_demand = demand_function(optimal_prices, base_demand, price_sensitivity, cross_elasticity_matrix)
optimal_profit = -profit_function(optimal_prices, base_demand, price_sensitivity,
cross_elasticity_matrix, costs)
print(f"Demand at optimal prices: {optimal_demand}")
print(f"Total profit at optimal prices: ${optimal_profit:.2f}")
price_range = 50
product_names = ["Basic Tier", "Premium Tier", "Enterprise Tier"]
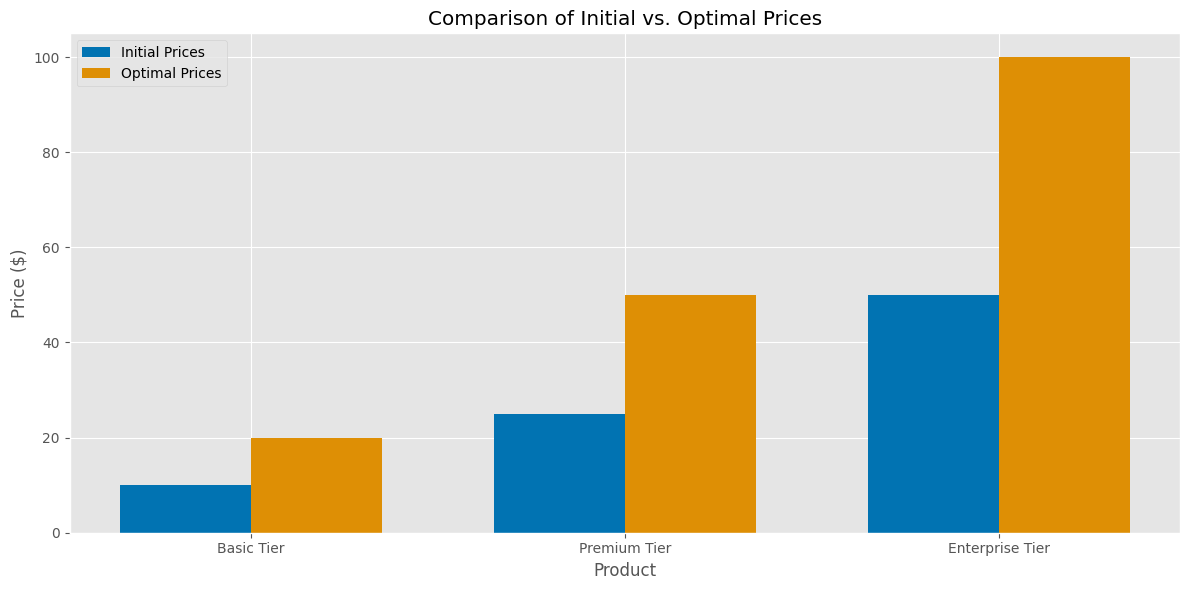
plt.figure(figsize=(12, 6))
width = 0.35
x = np.arange(num_products)
plt.bar(x - width/2, initial_prices, width, label='Initial Prices')
plt.bar(x + width/2, optimal_prices, width, label='Optimal Prices')
plt.xlabel('Product')
plt.ylabel('Price ($)')
plt.title('Comparison of Initial vs. Optimal Prices')
plt.xticks(x, product_names)
plt.legend()
plt.tight_layout()
plt.savefig('price_comparison.png', dpi=300)
plt.show()
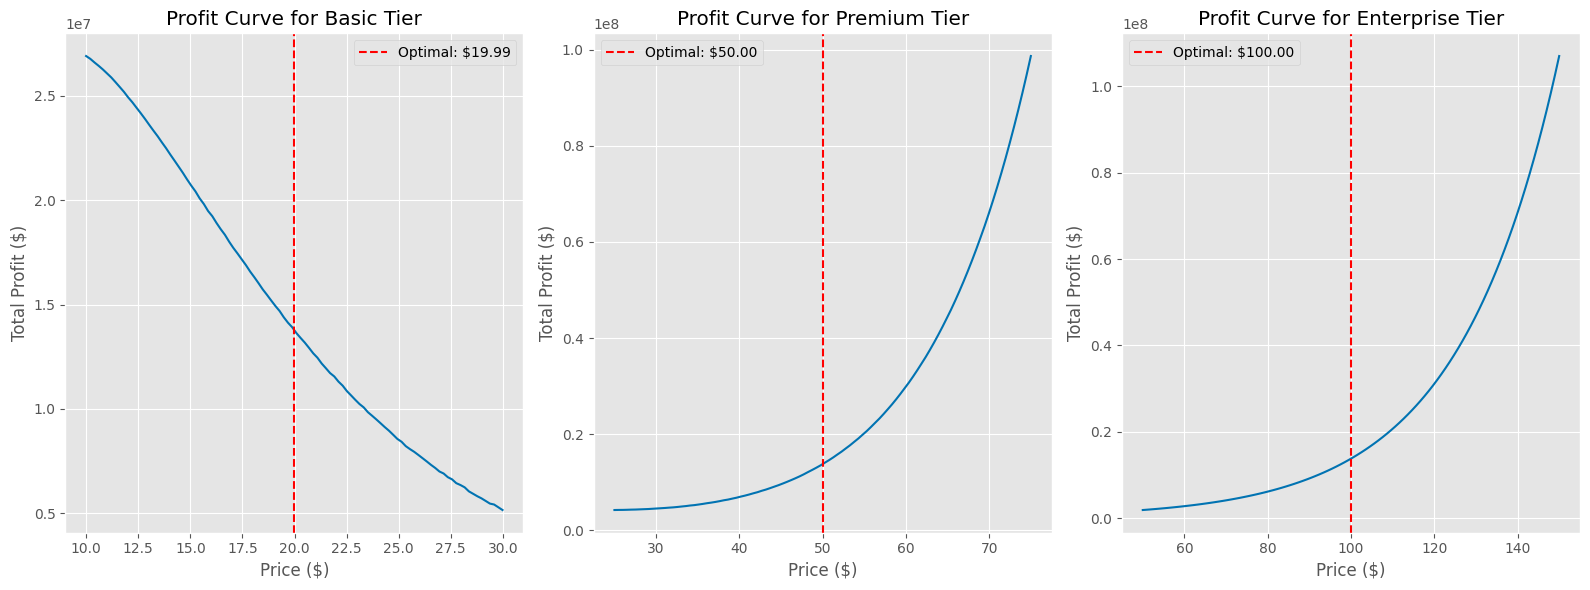
plt.figure(figsize=(16, 6))
for i in range(num_products):
plt.subplot(1, 3, i+1)
analysis_df = price_elasticity_analysis(
optimal_prices, i, price_range, base_demand,
price_sensitivity, cross_elasticity_matrix, costs
)
max_profit_idx = analysis_df['Profit'].idxmax()
max_profit_price = analysis_df.loc[max_profit_idx, 'Price']
plt.plot(analysis_df['Price'], analysis_df['Profit'])
plt.axvline(x=optimal_prices[i], color='red', linestyle='--',
label=f'Optimal: ${optimal_prices[i]:.2f}')
plt.title(f'Profit Curve for {product_names[i]}')
plt.xlabel('Price ($)')
plt.ylabel('Total Profit ($)')
plt.legend()
plt.grid(True)
plt.tight_layout()
plt.savefig('profit_curves.png', dpi=300)
plt.show()
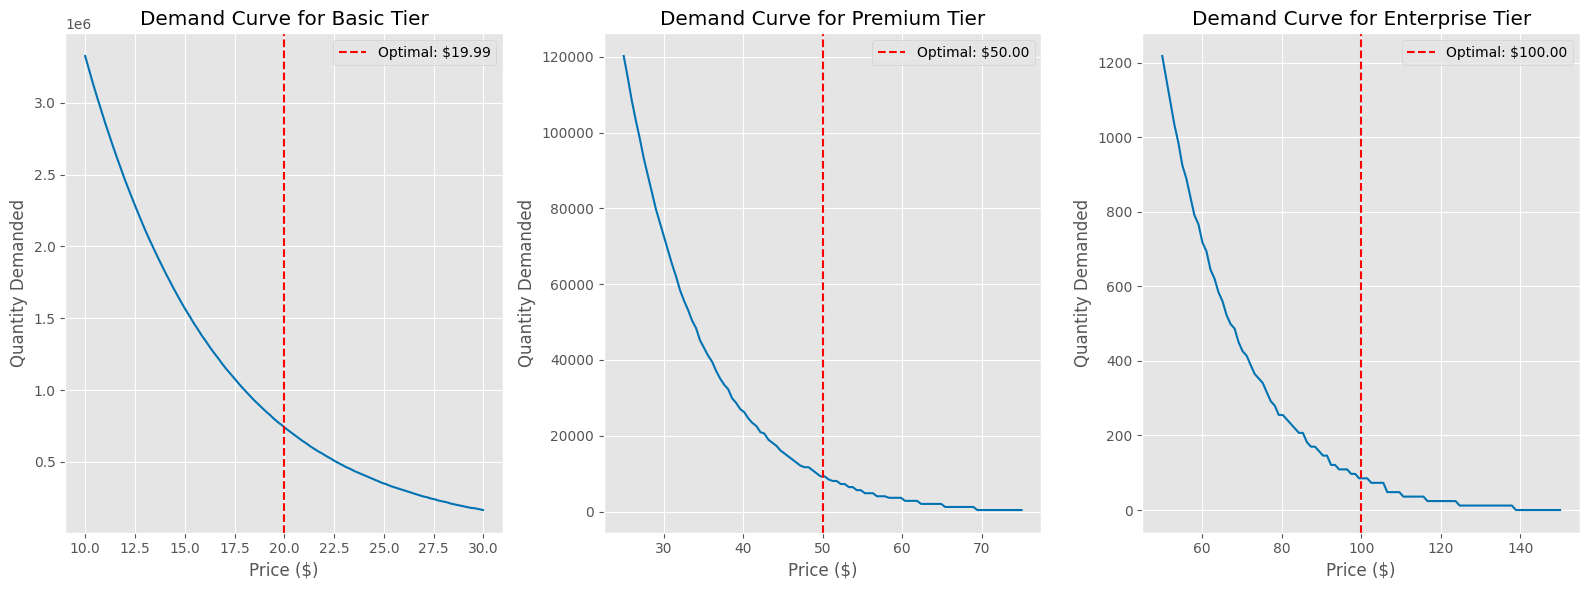
plt.figure(figsize=(16, 6))
for i in range(num_products):
plt.subplot(1, 3, i+1)
analysis_df = price_elasticity_analysis(
optimal_prices, i, price_range, base_demand,
price_sensitivity, cross_elasticity_matrix, costs
)
plt.plot(analysis_df['Price'], analysis_df['Demand'])
plt.axvline(x=optimal_prices[i], color='red', linestyle='--',
label=f'Optimal: ${optimal_prices[i]:.2f}')
plt.title(f'Demand Curve for {product_names[i]}')
plt.xlabel('Price ($)')
plt.ylabel('Quantity Demanded')
plt.legend()
plt.grid(True)
plt.tight_layout()
plt.savefig('demand_curves.png', dpi=300)
plt.show()
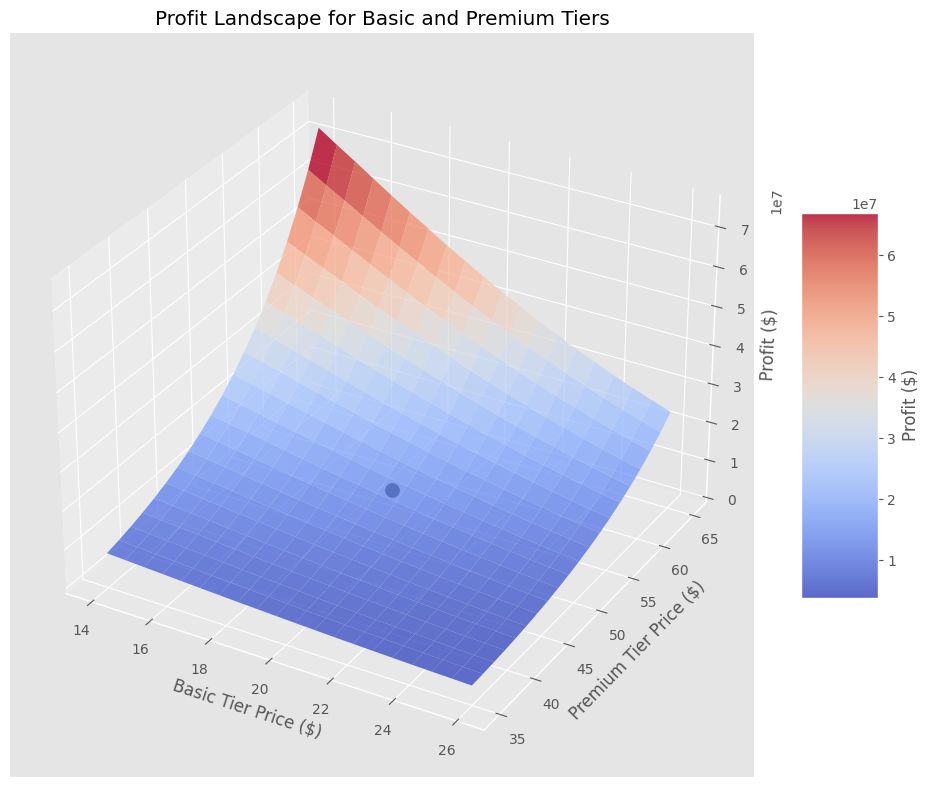
plt.figure(figsize=(12, 10))
ax = plt.axes(projection='3d')
price_range_percent = 30
p0_range = np.linspace(optimal_prices[0] * (1 - price_range_percent/100),
optimal_prices[0] * (1 + price_range_percent/100), 20)
p1_range = np.linspace(optimal_prices[1] * (1 - price_range_percent/100),
optimal_prices[1] * (1 + price_range_percent/100), 20)
P0, P1 = np.meshgrid(p0_range, p1_range)
profit_values = np.zeros(P0.shape)
for i in range(len(p0_range)):
for j in range(len(p1_range)):
current_prices = optimal_prices.copy()
current_prices[0] = P0[i, j]
current_prices[1] = P1[i, j]
profit_values[i, j] = -profit_function(current_prices, base_demand,
price_sensitivity, cross_elasticity_matrix, costs)
surf = ax.plot_surface(P0, P1, profit_values, cmap=cm.coolwarm,
linewidth=0, antialiased=True, alpha=0.8)
ax.scatter([optimal_prices[0]], [optimal_prices[1]],
[-profit_function(optimal_prices, base_demand, price_sensitivity,
cross_elasticity_matrix, costs)],
color='black', s=100, label='Optimal Price Point')
ax.set_xlabel('Basic Tier Price ($)')
ax.set_ylabel('Premium Tier Price ($)')
ax.set_zlabel('Profit ($)')
ax.set_title('Profit Landscape for Basic and Premium Tiers')
plt.colorbar(surf, ax=ax, shrink=0.5, aspect=5, label='Profit ($)')
plt.savefig('profit_landscape_3d.png', dpi=300)
plt.show()
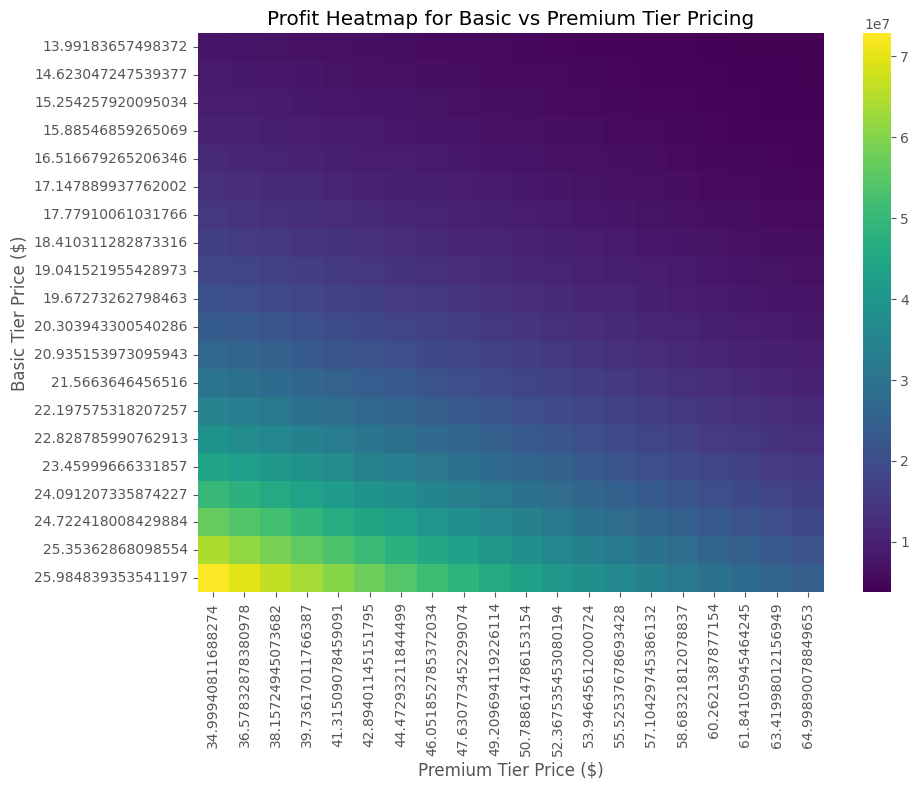
plt.figure(figsize=(10, 8))
profit_df = pd.DataFrame(profit_values, index=p0_range, columns=p1_range)
sns.heatmap(profit_df, cmap='viridis', annot=False)
plt.xlabel('Premium Tier Price ($)')
plt.ylabel('Basic Tier Price ($)')
plt.title('Profit Heatmap for Basic vs Premium Tier Pricing')
plt.tight_layout()
plt.savefig('profit_heatmap.png', dpi=300)
plt.show()
summary_data = {
'Product': product_names,
'Initial Price ($)': initial_prices,
'Optimal Price ($)': optimal_prices,
'Price Change (%)': (optimal_prices - initial_prices) / initial_prices * 100,
'Demand at Optimal': optimal_demand,
'Unit Profit ($)': optimal_prices - costs,
'Total Profit ($)': (optimal_prices - costs) * optimal_demand
}
summary_df = pd.DataFrame(summary_data)
summary_df['Price Change (%)'] = summary_df['Price Change (%)'].round(2)
summary_df['Unit Profit ($)'] = summary_df['Unit Profit ($)'].round(2)
summary_df['Total Profit ($)'] = summary_df['Total Profit ($)'].round(2)
print("\nSummary of Pricing Optimization Results:")
print(summary_df)
plt.figure(figsize=(8, 6))
sns.heatmap(cross_elasticity_matrix, annot=True, cmap='coolwarm',
xticklabels=product_names, yticklabels=product_names)
plt.title('Cross-Price Elasticity Matrix')
plt.xlabel('Price Change for Product')
plt.ylabel('Demand Impact on Product')
plt.tight_layout()
plt.savefig('cross_elasticity_heatmap.png', dpi=300)
plt.show()
|