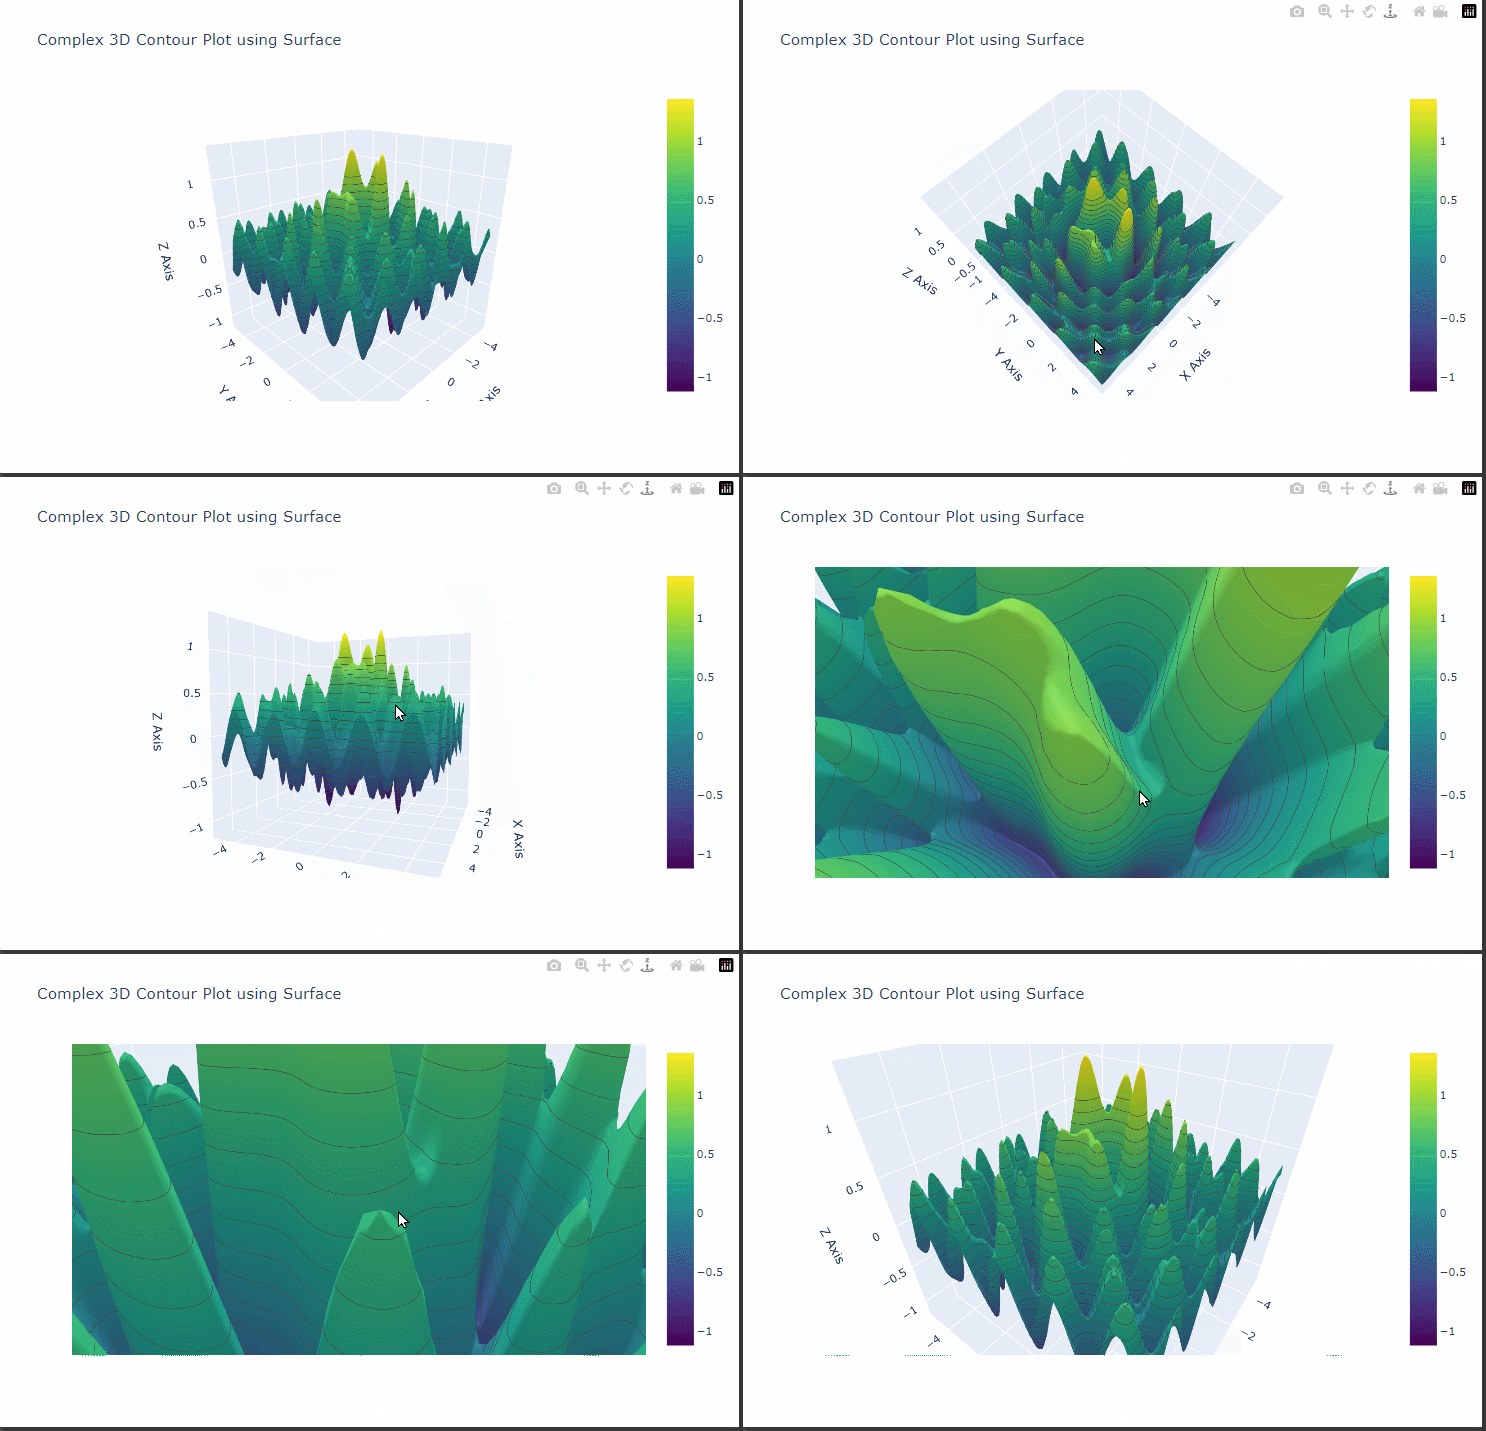
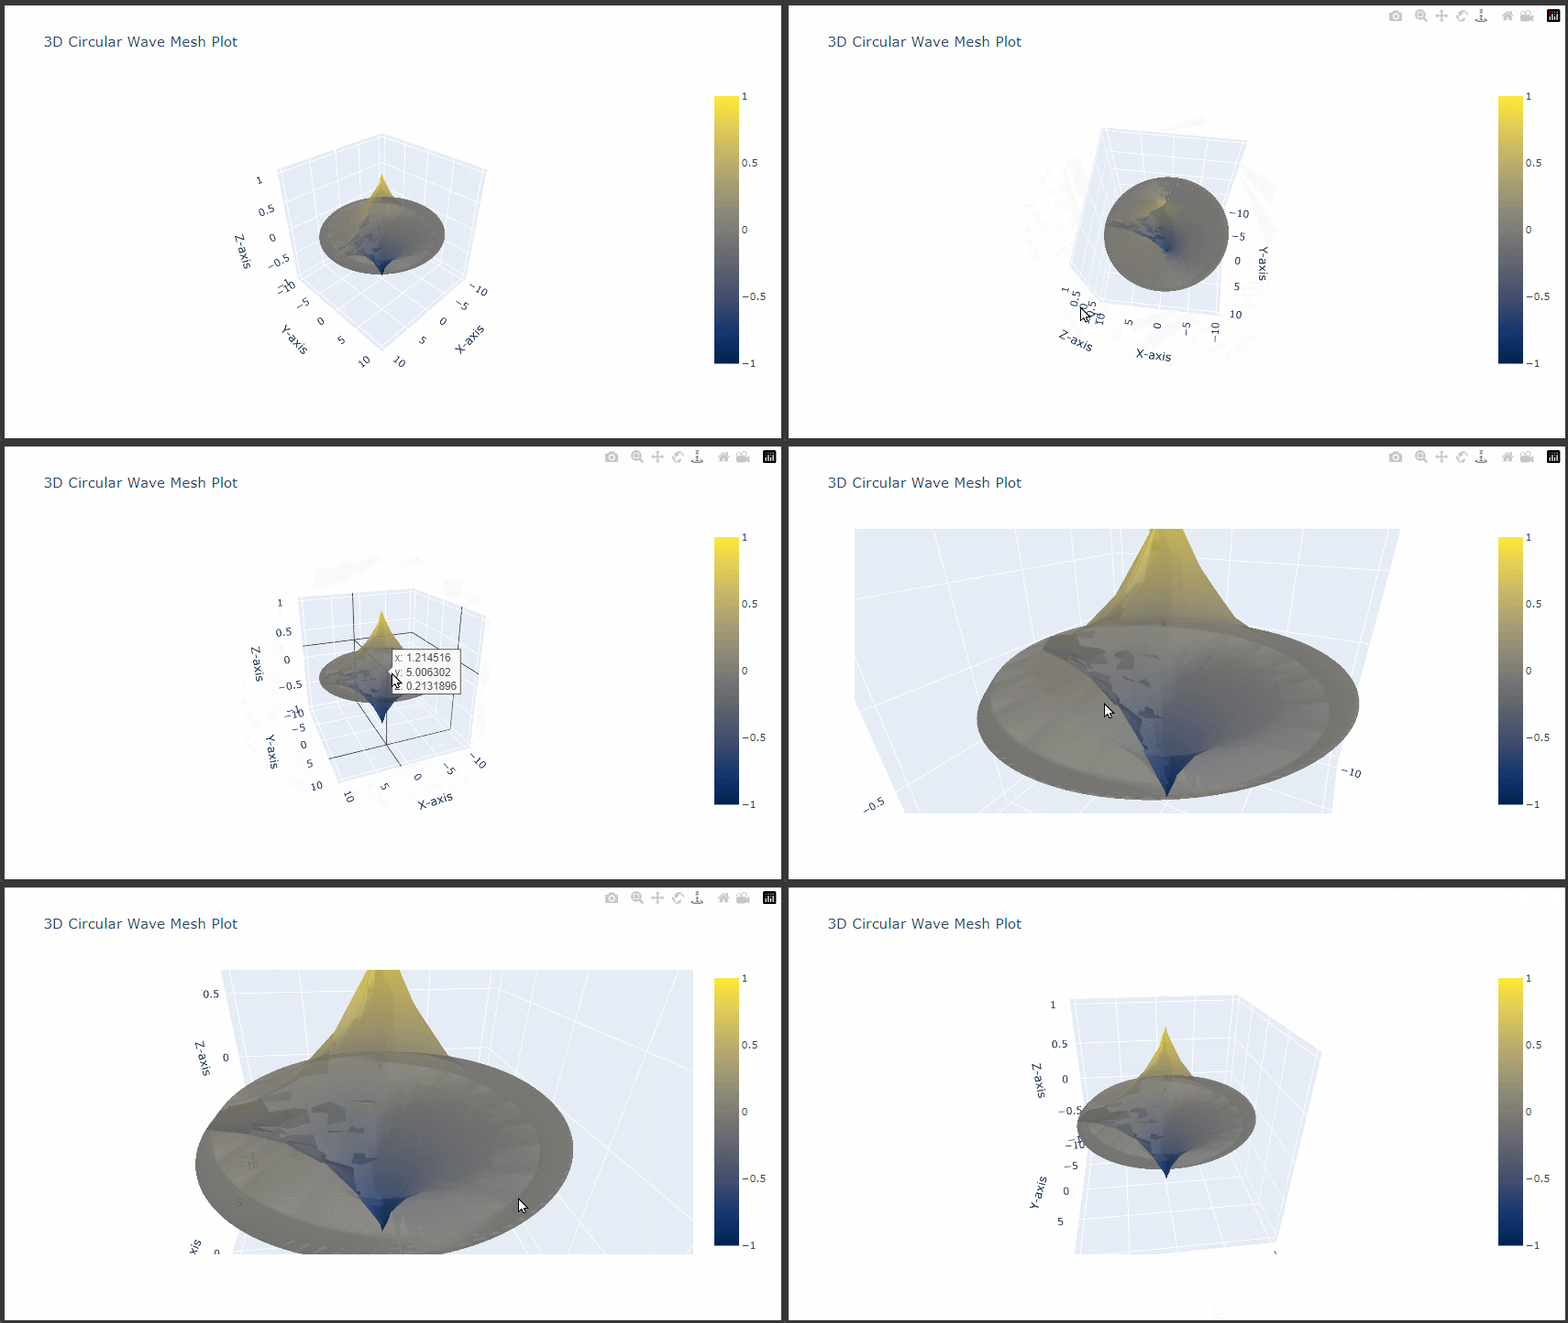
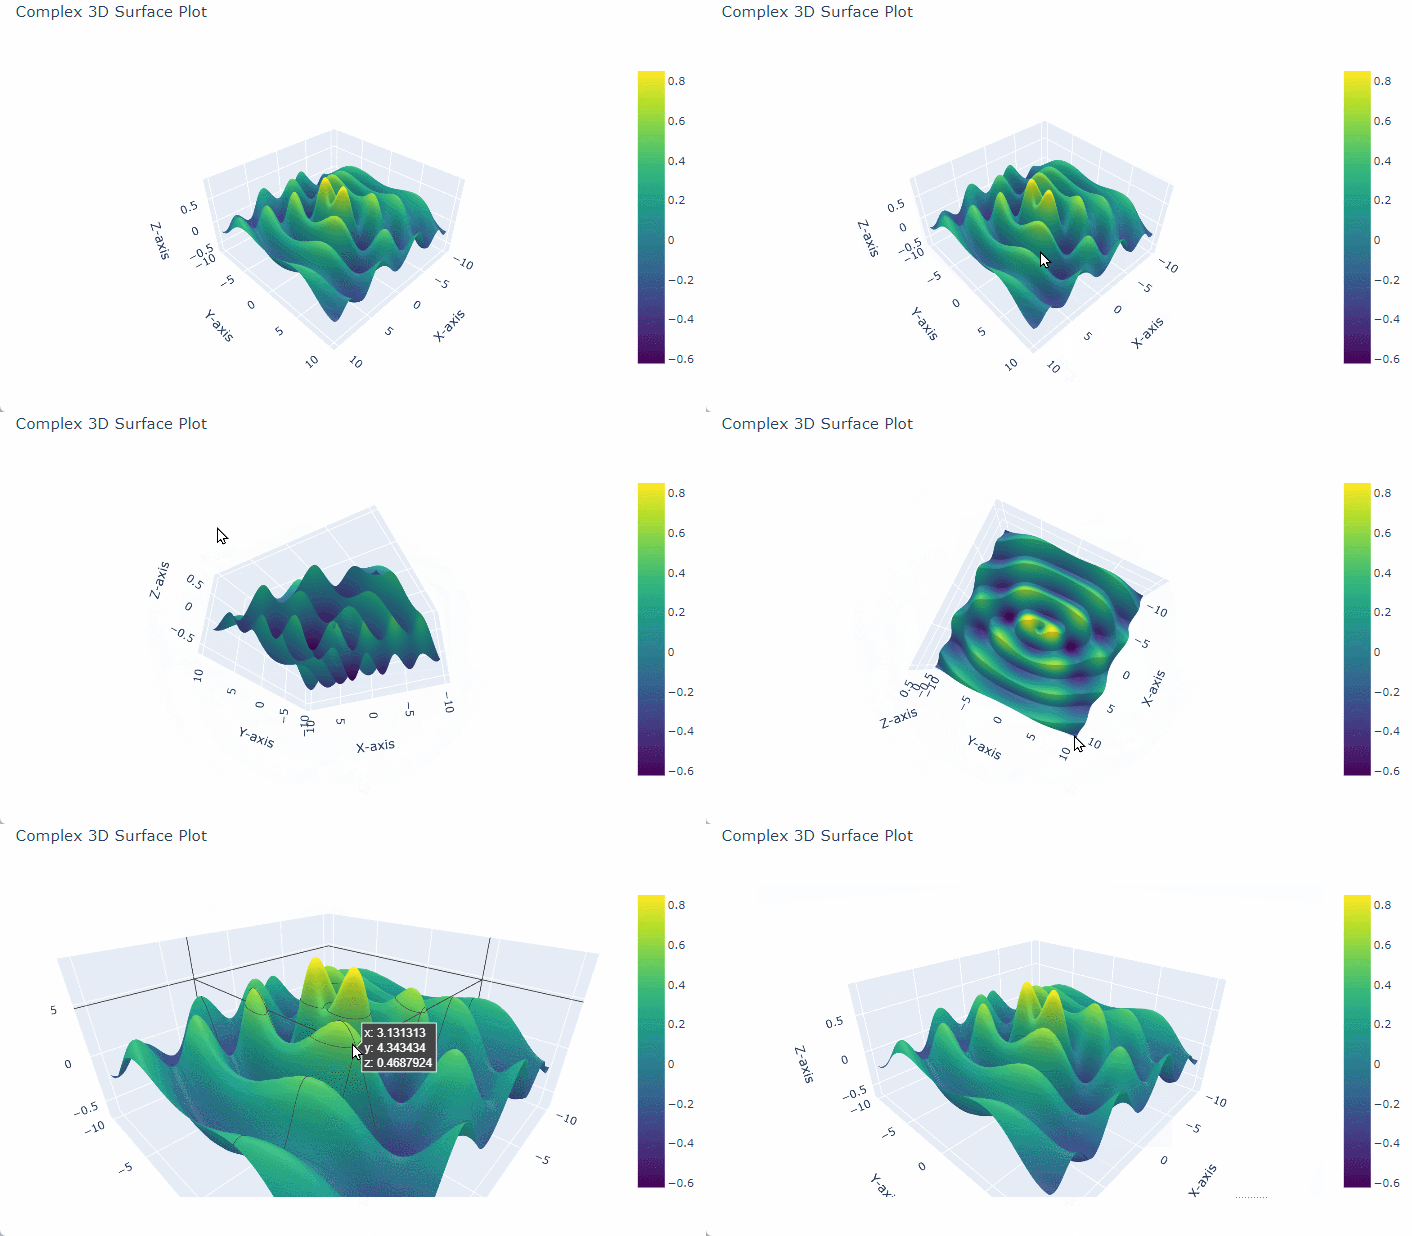
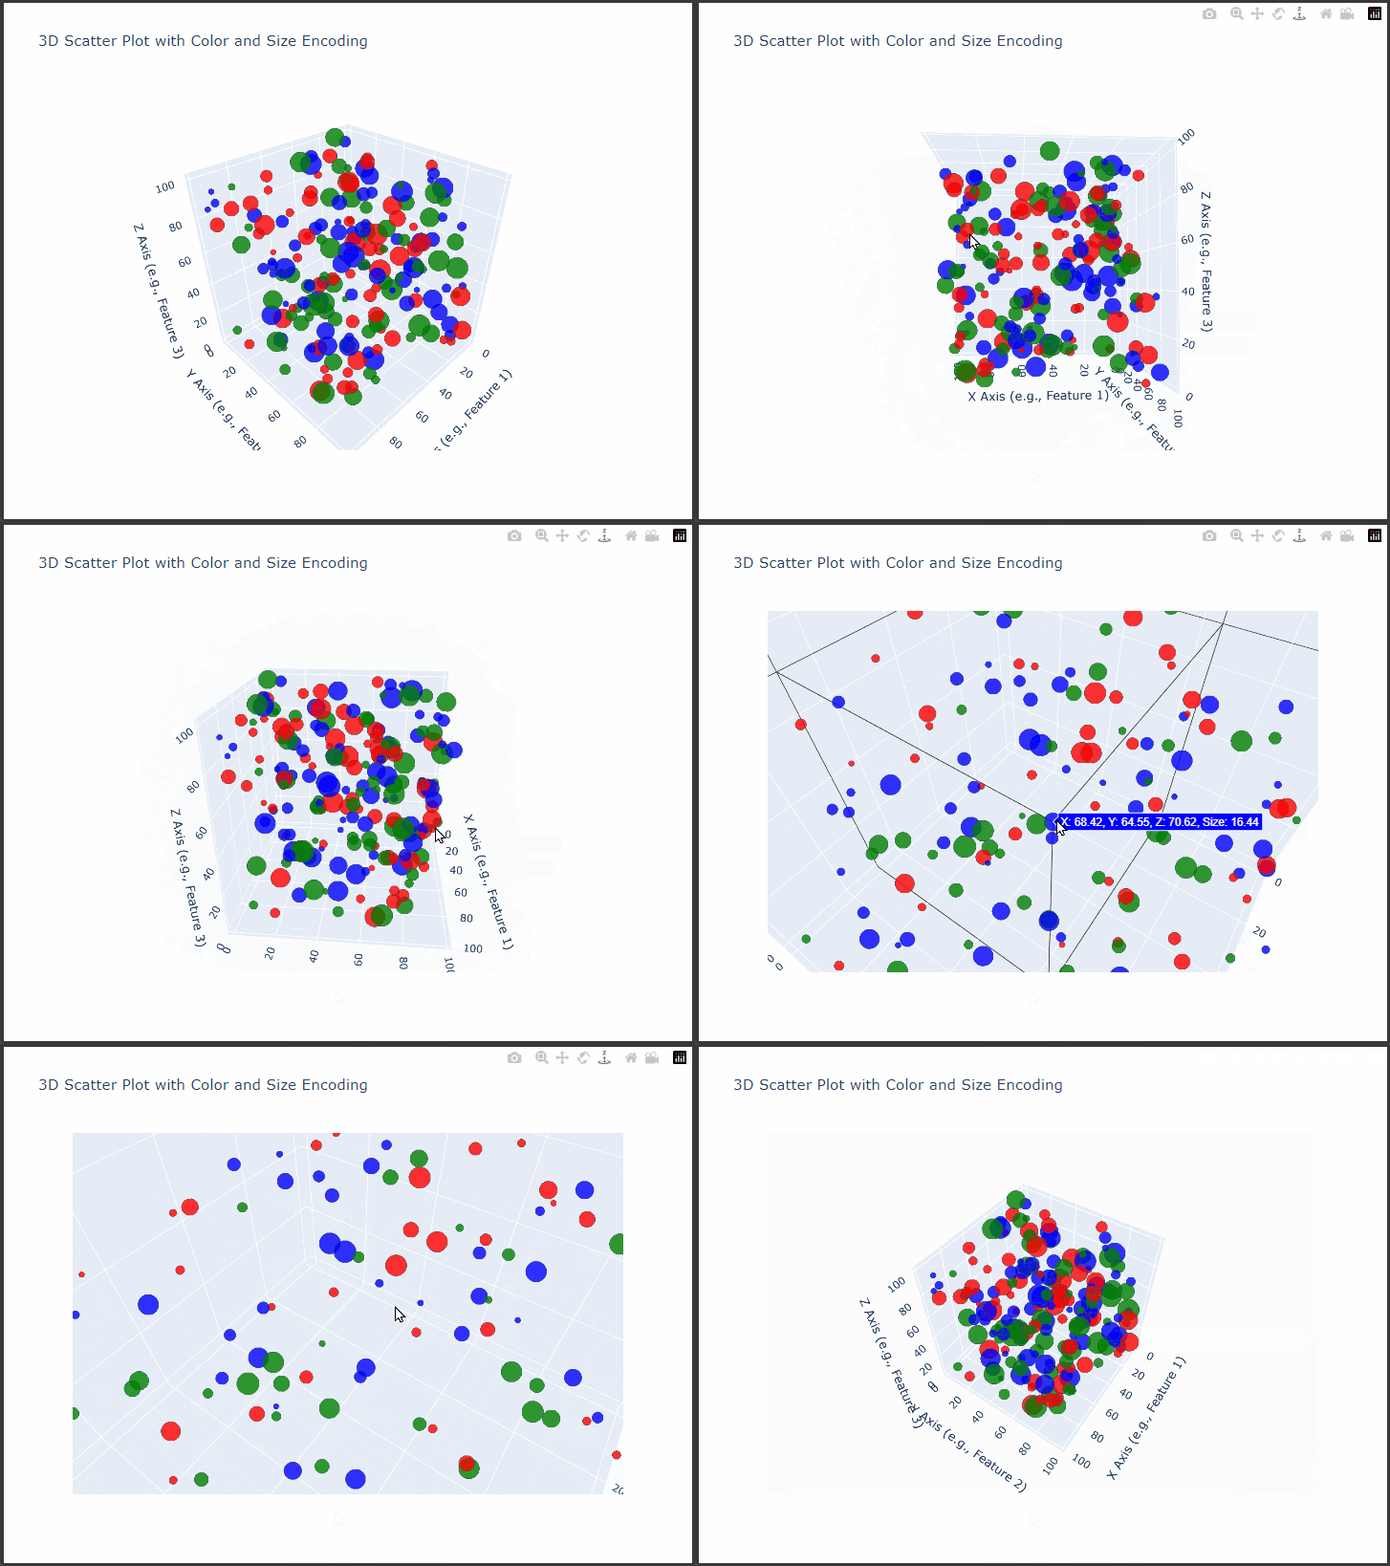
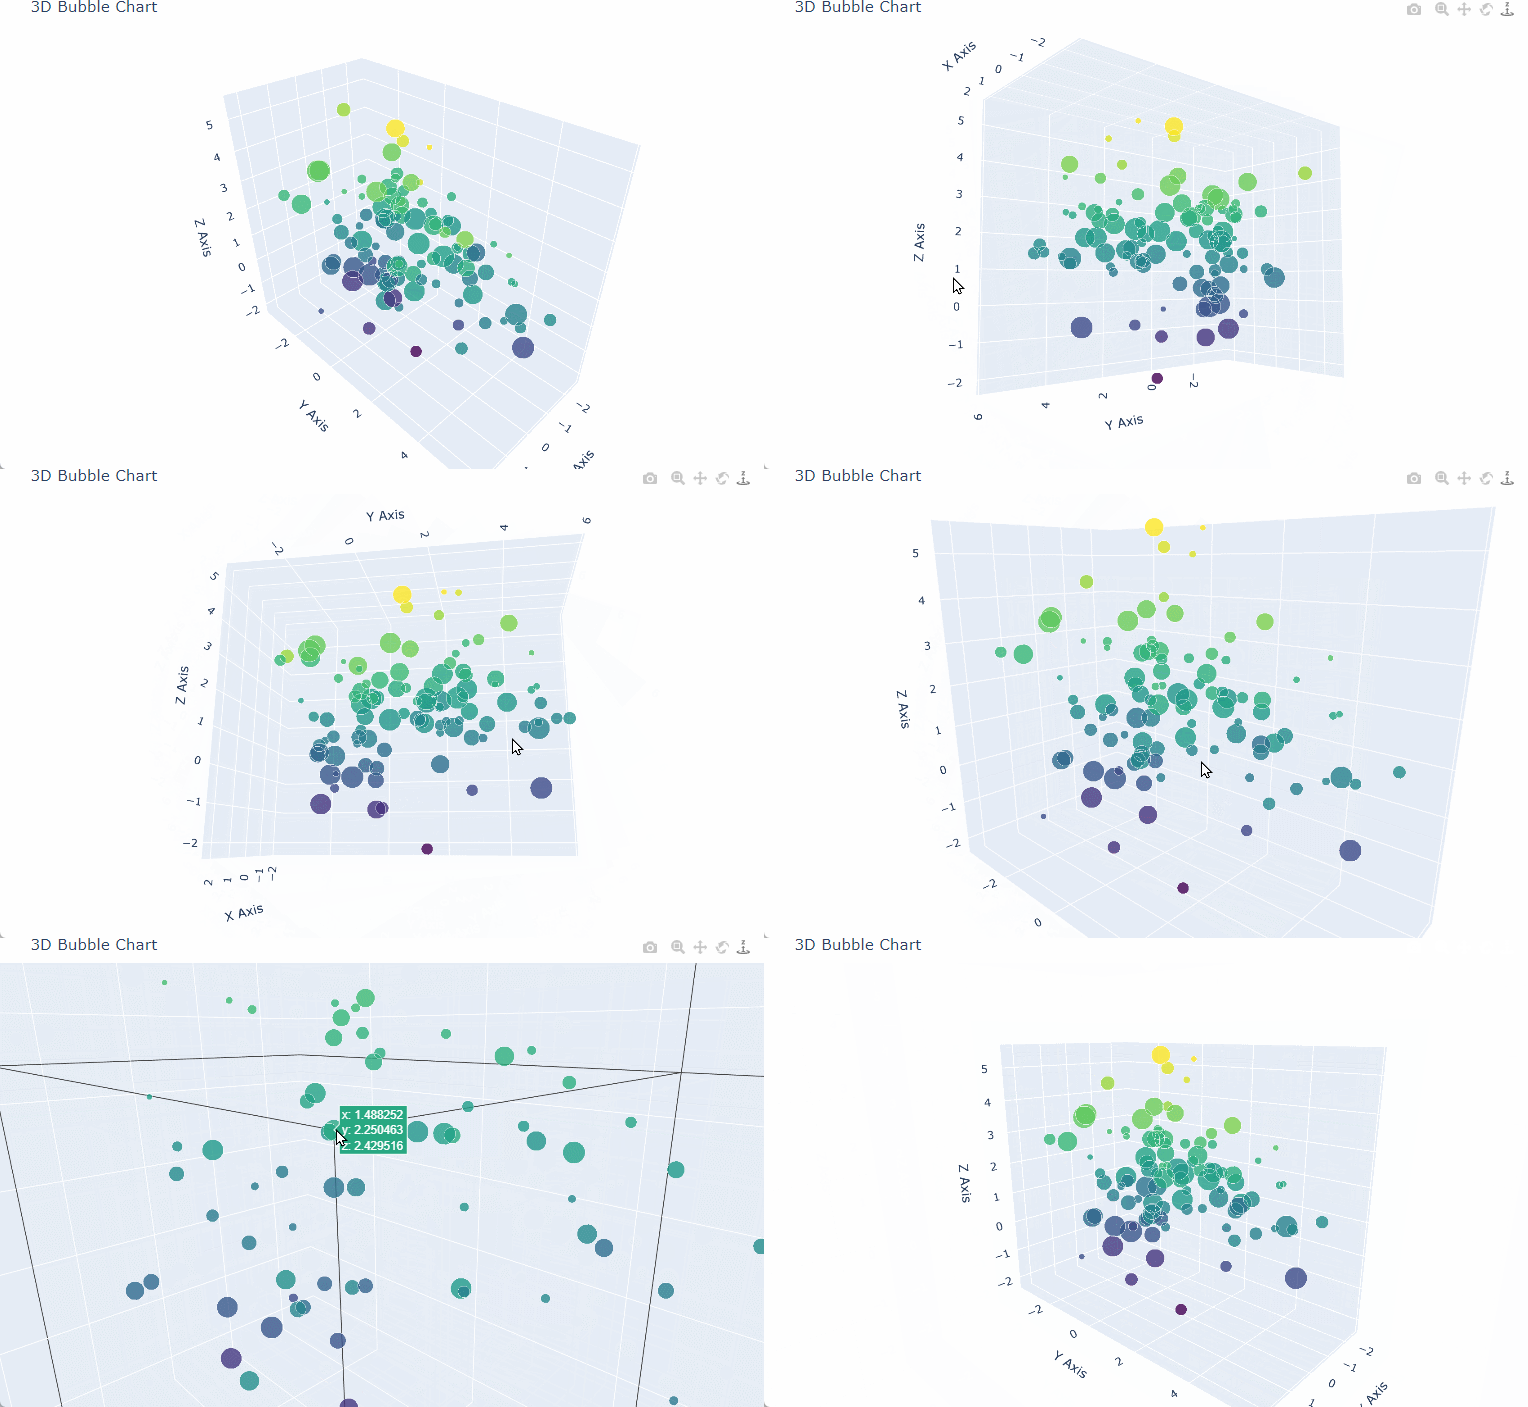
Creating a 3D bubble chart in $Python$ using plotly can effectively visualize data in three dimensions, with the addition of varying bubble sizes to represent a fourth data dimension.
In this example, we’ll use plotly.graph_objects to create a Scatter3d plot where each point (or bubble) has x, y, and z coordinates along with a size attribute for the bubble’s radius.
Here’s how to create a detailed 3D bubble chart with plotly.
Step-by-Step Code Explanation
- Generate Data: We’ll generate synthetic data for
x,y, andzcoordinates.
We’ll also create asizevariable to determine the size of each bubble. - Create a
Scatter3dPlot: Usingplotly.graph_objects, we’ll create aScatter3dobject to represent each bubble, where:x,y, andzcorrespond to the spatial coordinates.marker.sizecontrols the radius of each bubble.marker.coloris set to vary based on another variable for an additional data layer.
- Customize Layout: We’ll customize the layout to make the chart more informative and visually appealing.
Code Example
Here’s how you can implement a 3D bubble chart using plotly.
1 | import numpy as np |
Explanation of Key Components
Data Generation: We generate random data for
x,y, andzcoordinates, along with asizearray for bubble sizes.
This size variable can represent any additional metric, such as population, magnitude, or frequency.3D Scatter Plot with
Scatter3d:x,y, andzrepresent the spatial coordinates.marker.sizecontrols the size of each bubble.marker.coloruseszvalues (or another variable) to set bubble colors, adding a layer of information.
Customization:
- Color Scale: The
Viridiscolor scale is used for a visually pleasing gradient effect based onzvalues. - Opacity: Setting
opacity=0.8allows overlapping bubbles to blend slightly, enhancing the 3D effect. - Layout: Axes are labeled, and margins are adjusted for an optimal view.
- Color Scale: The
Summary
This 3D bubble chart effectively visualizes data across three spatial dimensions (x, y, and z), with the size of each bubble representing a fourth dimension.
This visualization is useful for showing multi-dimensional data, especially when analyzing clusters, correlations, or densities across multiple variables.