Scenario
We aim to analyze and visualize the GDP growth of a country over a period of years.
Using a dataset with GDP values, we calculate:
- Year-over-year growth rates.
- An average annual growth rate over the period.
- Visualization of the GDP trend and growth rates.
Python Implementation
1 | import numpy as np |
Code Explanation
Data Setup:
- Simulated GDP data is provided for years $2000$–$2020$.
- A DataFrame is created to store the year and GDP values.
Calculations:
- The year-over-year growth rate is calculated using the percentage change formula:

- The average annual growth rate is calculated as the mean of all growth rates.
- The year-over-year growth rate is calculated using the percentage change formula:
Visualization:
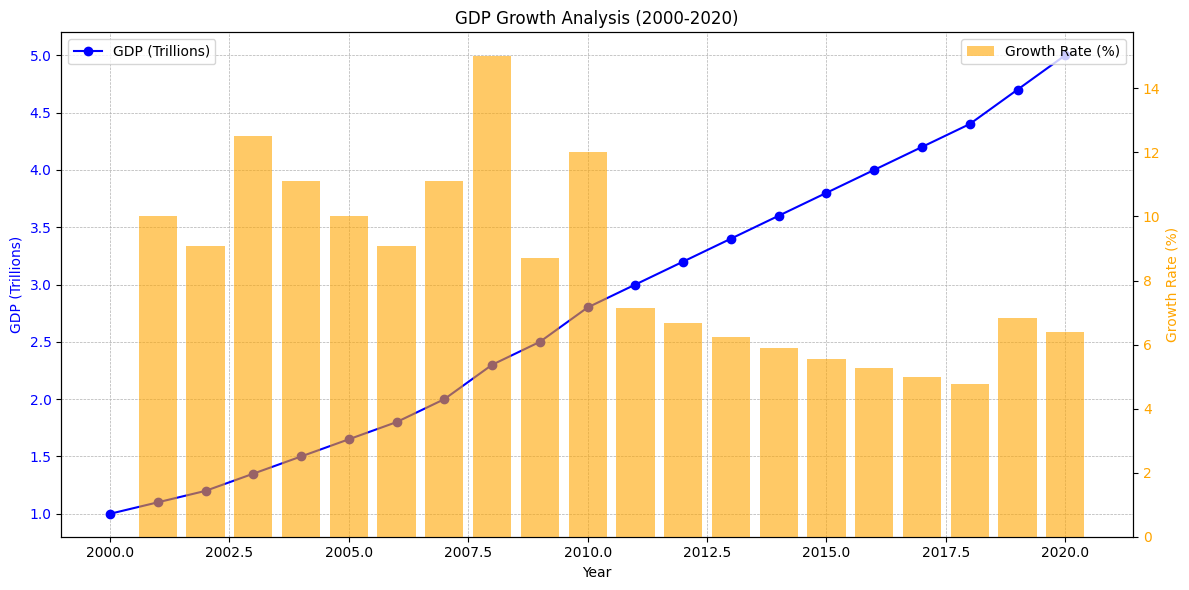
- GDP is plotted as a line chart to show the trend over time.
- Growth rates are plotted as a bar chart to emphasize yearly changes.
Results and Graph:
GDP Data with Growth Rates:
    Year   GDP  Growth Rate (%)
0   2000  1.00              NaN
1   2001  1.10        10.000000
2   2002  1.20         9.090909
3   2003  1.35        12.500000
4   2004  1.50        11.111111
5   2005  1.65        10.000000
6   2006  1.80         9.090909
7   2007  2.00        11.111111
8   2008  2.30        15.000000
9   2009  2.50         8.695652
10  2010  2.80        12.000000
11  2011  3.00         7.142857
12  2012  3.20         6.666667
13  2013  3.40         6.250000
14  2014  3.60         5.882353
15  2015  3.80         5.555556
16  2016  4.00         5.263158
17  2017  4.20         5.000000
18  2018  4.40         4.761905
19  2019  4.70         6.818182
20  2020  5.00         6.382979

Average Annual Growth Rate: 8.42%
Data Analysis:
- The printed DataFrame includes the GDP values and their corresponding growth rates.
- The average annual growth rate is displayed for overall assessment.
Visualization:
- Line Chart: Shows the upward trend of GDP over the years.
- Bar Chart: Highlights variations in growth rates year-over-year.
This graph effectively communicates both the long-term growth trend and the yearly fluctuations in GDP growth rates, providing a clear picture of economic performance.