Dash Cytoscape⑪(ノードの配置方法 / breadthfirst)

階層的(breadthfirst)

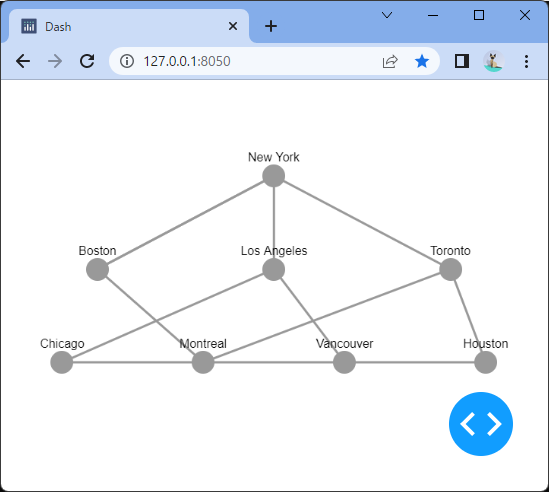
レイアウト辞書の“name”キー“breadthfirst”を指定すると、ノードを階層的に配置することができます。(47行目)

デフォルトでは、ルートとなるノードが自動で推測されますが、オプションとして“roots”キーノードIDを指定すると、任意のノードをルートに設定できます。(48行目)

[ソースコード]

1
2
3
4
5
6
7
8
9
10
11
12
13
14
15
16
17
18
19
20
21
22
23
24
25
26
27
28
29
30
31
32
33
34
35
36
37
38
39
40
41
42
43
44
45
46
47
48
49
50
51
52
53
54
import dash
import dash_cytoscape as cyto
import dash_html_components as html

app = dash.Dash(__name__)

nodes = [
{
'data': {'id': short, 'label': label}
}
for short, label in (
('la', 'Los Angeles'),
('nyc', 'New York'),
('to', 'Toronto'),
('mtl', 'Montreal'),
('van', 'Vancouver'),
('chi', 'Chicago'),
('bos', 'Boston'),
('hou', 'Houston')
)
]

edges = [
{'data': {'source': source, 'target': target}}
for source, target in (
('van', 'la'),
('la', 'chi'),
('hou', 'chi'),
('to', 'mtl'),
('mtl', 'bos'),
('nyc', 'bos'),
('to', 'hou'),
('to', 'nyc'),
('la', 'nyc'),
('nyc', 'bos')
)
]

elements = nodes + edges

app.layout = html.Div([
cyto.Cytoscape(
id='cytoscape-layout-3',
elements=elements,
style={'width': '100%', 'height': '350px'},
layout={
'name': 'breadthfirst',
'roots': '[id = "nyc"]'
}
)
])

if __name__ == '__main__':
app.run_server(debug=True)

[ブラウザで表示]

New Yorkをrootとして階層的にノードを配置することができました。

Dash Cytoscape⑩(ノードの配置方法 / concentric)

同心円状(concentric)

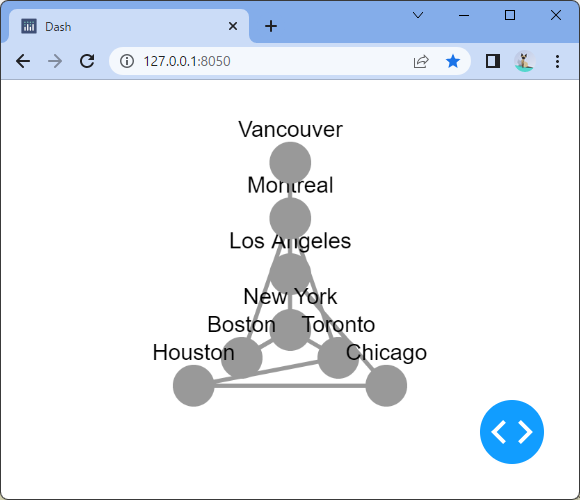
レイアウト辞書の“name”キー“concentric”を指定すると、ノードを同心円状に配置することができます。(47行目)

[ソースコード]

1
2
3
4
5
6
7
8
9
10
11
12
13
14
15
16
17
18
19
20
21
22
23
24
25
26
27
28
29
30
31
32
33
34
35
36
37
38
39
40
41
42
43
44
45
46
47
48
49
50
51
52
53
import dash
import dash_cytoscape as cyto
import dash_html_components as html

app = dash.Dash(__name__)

nodes = [
{
'data': {'id': short, 'label': label}
}
for short, label in (
('la', 'Los Angeles'),
('nyc', 'New York'),
('to', 'Toronto'),
('mtl', 'Montreal'),
('van', 'Vancouver'),
('chi', 'Chicago'),
('bos', 'Boston'),
('hou', 'Houston')
)
]

edges = [
{'data': {'source': source, 'target': target}}
for source, target in (
('van', 'la'),
('la', 'chi'),
('hou', 'chi'),
('to', 'mtl'),
('mtl', 'bos'),
('nyc', 'bos'),
('to', 'hou'),
('to', 'nyc'),
('la', 'nyc'),
('nyc', 'bos')
)
]

elements = nodes + edges

app.layout = html.Div([
cyto.Cytoscape(
id='cytoscape-layout-3',
elements=elements,
style={'width': '100%', 'height': '350px'},
layout={
'name': 'concentric'
}
)
])

if __name__ == '__main__':
app.run_server(debug=True)

[ブラウザで表示]

ノードを同心円状に配置することができました。

Dash Cytoscape⑨(ノードの配置方法 / grid)

格子状(grid)

レイアウト辞書の“name”キー“grid”を指定すると、ノードを格子状に配置することができます。(47行目)

オプションとして“rows”キー“columns”キー(48~49行目)を指定することで、行数列数を設定することができます。

[ソースコード]

1
2
3
4
5
6
7
8
9
10
11
12
13
14
15
16
17
18
19
20
21
22
23
24
25
26
27
28
29
30
31
32
33
34
35
36
37
38
39
40
41
42
43
44
45
46
47
48
49
50
51
52
53
54
55
import dash
import dash_cytoscape as cyto
import dash_html_components as html

app = dash.Dash(__name__)

nodes = [
{
'data': {'id': short, 'label': label}
}
for short, label in (
('la', 'Los Angeles'),
('nyc', 'New York'),
('to', 'Toronto'),
('mtl', 'Montreal'),
('van', 'Vancouver'),
('chi', 'Chicago'),
('bos', 'Boston'),
('hou', 'Houston')
)
]

edges = [
{'data': {'source': source, 'target': target}}
for source, target in (
('van', 'la'),
('la', 'chi'),
('hou', 'chi'),
('to', 'mtl'),
('mtl', 'bos'),
('nyc', 'bos'),
('to', 'hou'),
('to', 'nyc'),
('la', 'nyc'),
('nyc', 'bos')
)
]

elements = nodes + edges

app.layout = html.Div([
cyto.Cytoscape(
id='cytoscape-layout-3',
elements=elements,
style={'width': '100%', 'height': '350px'},
layout={
'name': 'grid',
'rows': 3,
'columns': 3
}
)
])

if __name__ == '__main__':
app.run_server(debug=True)

[ブラウザで表示]

ノードを3行3列の格子状に配置することができました。

Dash Cytoscape⑧(ノードの配置方法 / circle)

円形(circle)

レイアウト辞書の“name”キー“circle”を指定すると、ノードを円形に配置することができます。(46~48行目)

[ソースコード]

1
2
3
4
5
6
7
8
9
10
11
12
13
14
15
16
17
18
19
20
21
22
23
24
25
26
27
28
29
30
31
32
33
34
35
36
37
38
39
40
41
42
43
44
45
46
47
48
49
50
51
52
53
import dash
import dash_cytoscape as cyto
import dash_html_components as html

app = dash.Dash(__name__)

nodes = [
{
'data': {'id': short, 'label': label}
}
for short, label in (
('la', 'Los Angeles'),
('nyc', 'New York'),
('to', 'Toronto'),
('mtl', 'Montreal'),
('van', 'Vancouver'),
('chi', 'Chicago'),
('bos', 'Boston'),
('hou', 'Houston')
)
]

edges = [
{'data': {'source': source, 'target': target}}
for source, target in (
('van', 'la'),
('la', 'chi'),
('hou', 'chi'),
('to', 'mtl'),
('mtl', 'bos'),
('nyc', 'bos'),
('to', 'hou'),
('to', 'nyc'),
('la', 'nyc'),
('nyc', 'bos')
)
]

elements = nodes + edges

app.layout = html.Div([
cyto.Cytoscape(
id='cytoscape-layout-2',
elements=elements,
style={'width': '100%', 'height': '350px'},
layout={
'name': 'circle'
}
)
])

if __name__ == '__main__':
app.run_server(debug=True)

[ブラウザで表示]

ノードを円形に配置することができました。

Dash Cytoscape⑦(ノードの配置方法 / preset)

手動的な配置(preset)

ノードを手動で配置する場合、配置方法をpresetに指定します。

手動的な配置は、ノードの位置に特定の意味を持たせる場合(緯度・経度など)や、別のネットワーク分析のツール(NetworkXなど)であらかじめ計算しておいた配置を利用する場合などに使われます。

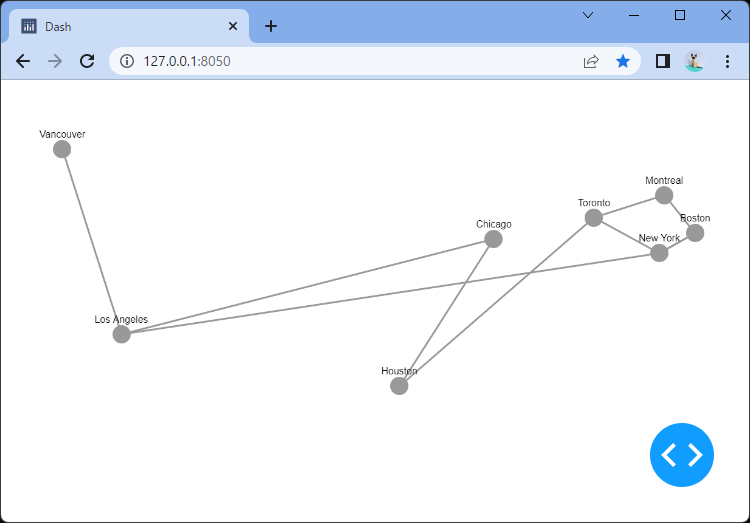
以下のソースでは、アメリカの都市の緯度・経度に合わせてX,Y座標を定義しています。(8~21行目)

[ソースコード]

1
2
3
4
5
6
7
8
9
10
11
12
13
14
15
16
17
18
19
20
21
22
23
24
25
26
27
28
29
30
31
32
33
34
35
36
37
38
39
40
41
42
43
44
45
46
47
48
49
50
51
52
53
54
import dash
import dash_cytoscape as cyto
import dash_html_components as html

app = dash.Dash(__name__)

nodes = [
{
'data': {'id': short, 'label': label},
'position': {'x': 20 * lat, 'y': -20 * long}
}
for short, label, long, lat in (
('la', 'Los Angeles', 34.03, -118.25),
('nyc', 'New York', 40.71, -74),
('to', 'Toronto', 43.65, -79.38),
('mtl', 'Montreal', 45.50, -73.57),
('van', 'Vancouver', 49.28, -123.12),
('chi', 'Chicago', 41.88, -87.63),
('bos', 'Boston', 42.36, -71.06),
('hou', 'Houston', 29.76, -95.37)
)
]

edges = [
{'data': {'source': source, 'target': target}}
for source, target in (
('van', 'la'),
('la', 'chi'),
('hou', 'chi'),
('to', 'mtl'),
('mtl', 'bos'),
('nyc', 'bos'),
('to', 'hou'),
('to', 'nyc'),
('la', 'nyc'),
('nyc', 'bos')
)
]

elements = nodes + edges

app.layout = html.Div([
cyto.Cytoscape(
id='cytoscape-layout-1',
elements=elements,
style={'width': '100%', 'height': '350px'},
layout={
'name': 'preset'
}
)
])

if __name__ == '__main__':
app.run_server(debug=True)

[ブラウザで表示]

都市の緯度・経度に合わせて、ノードが配置されました。

Dash Cytoscape⑥(ノードの配置方法)

ノードの配置方法

Cytoscapeクラスでは、インスタンス生成時の引数layoutに辞書型のデータを設定することにより、ノードの配置方法を指定できます。

レイアウトに指定できる配置方法の種類は以下の通りです。

配置方法 説明
preset 各ノードの座標を手動で指定する。
 position:X,Y座標
grid 格子状にノードを配置する。
 row:格子の行数
 cols:格子の列数
circle 円状にノードを配置する。
 radius:円の半径
 startAngle:ノードの開始位置の角度(弧度法)
 sweep:最初のノードと最後のノードの間の角度(弧度法)
concentric 同心円状にノードを配置する。
 startAngle:ノードの開始位置の角度(弧度法)
 sweep:最初のノードと死後のノードの間の角度(弧度法)
breadthfirst 階層的にノードを配置する。
 roots:ルートとなるノードのID
 circle:描画モード ( top-down / circle )
cose 物理シミュレーションに基づいてノードを配置する。複合グラフが考慮される。
 gravity:物理シミュレーション時に使われる重力の値
random ランダムな位置にノードを配置する。

次回から、それぞれの配置方法を使ってネットワーク図を表示していきます。

Dash Cytoscape⑤(複合ノード)

複合ノード

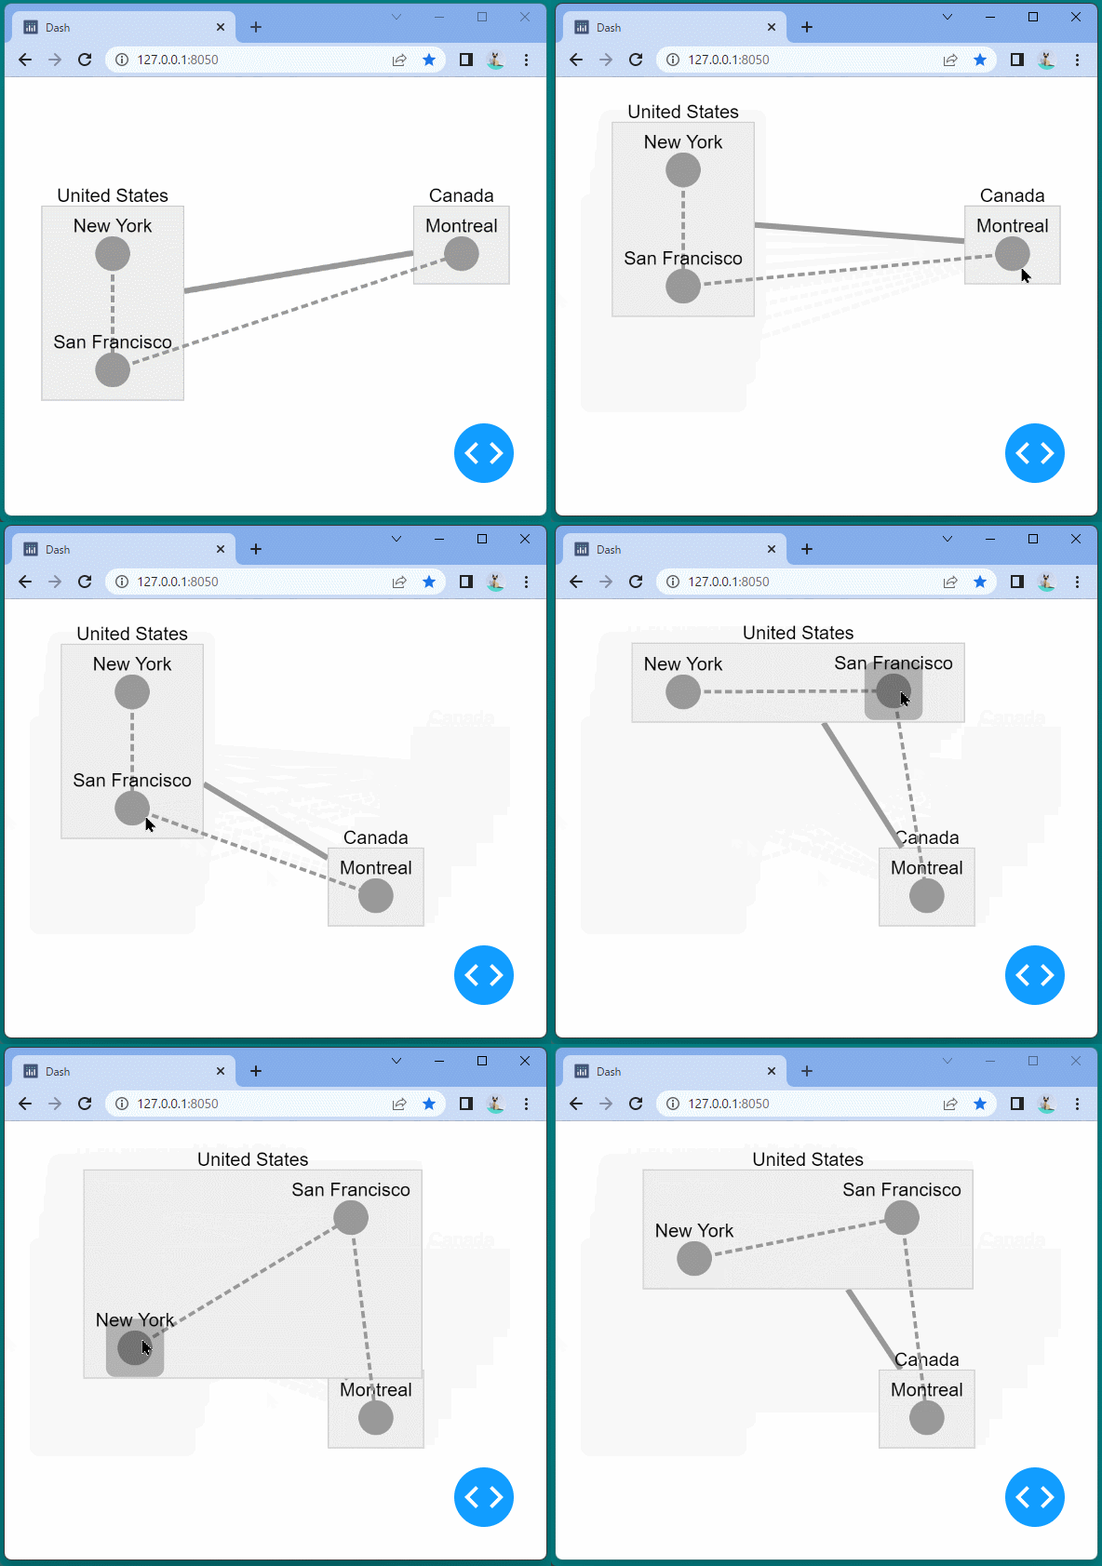
複合ノード(Compoundノード)を使うと、ノード間に親子関係を作ることができます。

子ノードの “parent”キーに親ノードのIDを指定して親子関係を定義します。

[ソースコード]

1
2
3
4
5
6
7
8
9
10
11
12
13
14
15
16
17
18
19
20
21
22
23
24
25
26
27
28
29
30
31
32
33
34
35
36
37
38
39
40
41
42
43
44
45
46
47
48
49
50
51
52
53
54
55
56
57
58
59
60
61
62
63
64
65
66
67
import dash
import dash_cytoscape as cyto
import dash_html_components as html

app = dash.Dash(__name__)

app.layout = html.Div([
cyto.Cytoscape(
id='cytoscape-compound',
layout={'name': 'preset'},
style={'width': '100%', 'height': '450px'},
stylesheet=[
{
'selector': 'node',
'style': {'content': 'data(label)'}
},
{
'selector': '.countries',
'style': {'width': 5}
},
{
'selector': '.cities',
'style': {'line-style': 'dashed'}
}
],
elements=[
# Parent Nodes
{
'data': {'id': 'us', 'label': 'United States'}
},
{
'data': {'id': 'can', 'label': 'Canada'}
},

# Children Nodes
{
'data': {'id': 'nyc', 'label': 'New York', 'parent': 'us'},
'position': {'x': 100, 'y': 100}
},
{
'data': {'id': 'sf', 'label': 'San Francisco', 'parent': 'us'},
'position': {'x': 100, 'y': 200}
},
{
'data': {'id': 'mtl', 'label': 'Montreal', 'parent': 'can'},
'position': {'x': 400, 'y': 100}
},

# Edges
{
'data': {'source': 'can', 'target': 'us'},
'classes': 'countries'
},
{
'data': {'source': 'nyc', 'target': 'sf'},
'classes': 'cities'
},
{
'data': {'source': 'sf', 'target': 'mtl'},
'classes': 'cities'
}
]
)
])

if __name__ == '__main__':
app.run_server(debug=True)

[ブラウザで表示]

親ノード(United States / Canada)のサイズは、子ノードに合わせて自動的に計算されます。

子ノードを移動させると、その親ノードの範囲も自動で変わります。

また親ノードを移動させるとその親ノードに属する子ノードもまとめて移動します。

Dash Cytoscape④(スタイル設定)

スタイル設定

ネットワークの関係を把握したいとき、ノート間の重みによってエッジの重さ(大きさ)を変えたり、同じ属性を持つノードの色や形を統一したりすることで、ネットワーク構造をより把握しやすくなります。

スタイル設定(セレクタ文字列)

Cytoscapeクラスでは、インスタンス生成時に引数stylesheetにスタイルを記述することで、ノードやエッジにスタイル(色・幅・形など)を適用できます。

スタイルの設定手順は下記の通りです。

  1. 引数stylesheetに、スタイル設定のリストを記述する。
    スタイル設定は複数指定でき、個々のスタイル設定は “selector”キーで指定します。
  2. “selector”キーには、スタイルの適用範囲を文字列で指定する。
  3. 各要素の “classes”キーに、2で定義した “selector”キーを設定する。
    複数の “selector”を設定する場合は、半角スペースで区切って設定する。

[ソースコード]

1
2
3
4
5
6
7
8
9
10
11
12
13
14
15
16
17
18
19
20
21
22
23
24
25
26
27
28
29
30
31
32
33
34
35
36
37
38
39
40
41
42
43
44
45
46
47
48
49
50
51
52
53
54
55
56
57
58
59
60
61
62
63
64
65
66
import dash
import dash_cytoscape as cyto
import dash_html_components as html

app = dash.Dash(__name__)

my_stylesheet = [
# Group selectors
{
'selector': 'node',
'style': {
'content': 'data(label)'
}
},
# Class selectors
{
'selector': '.red',
'style': {
'background-color': 'red',
'line-color': 'red'
}
},
{
'selector': '.triangle',
'style': {
'shape': 'triangle'
}
}
]

app.layout = html.Div([
cyto.Cytoscape(
id='cytoscape-elements-classes',
layout={'name': 'preset'},
style={'width': '100%', 'height': '400px'},
stylesheet=my_stylesheet,
elements=[
{
'data': {'id': 'one', 'label': 'Modified Color'},
'position': {'x': 75, 'y': 75},
'classes': 'red' # Single class
},
{
'data': {'id': 'two', 'label': 'Modified Shape'},
'position': {'x': 75, 'y': 200},
'classes': 'triangle' # Single class
},
{
'data': {'id': 'three', 'label': 'Both Modified'},
'position': {'x': 200, 'y': 75},
'classes': 'red triangle' # Multiple classes
},
{
'data': {'id': 'four', 'label': 'Regular'},
'position': {'x': 200, 'y': 200}
},
{'data': {'source': 'one', 'target': 'two'}, 'classes': 'red'},
{'data': {'source': 'two', 'target': 'three'}},
{'data': {'source': 'three', 'target': 'four'}, 'classes': 'red'},
{'data': {'source': 'two', 'target': 'four'}},
]
)
])

if __name__ == '__main__':
app.run_server(debug=True)

[ブラウザで表示]

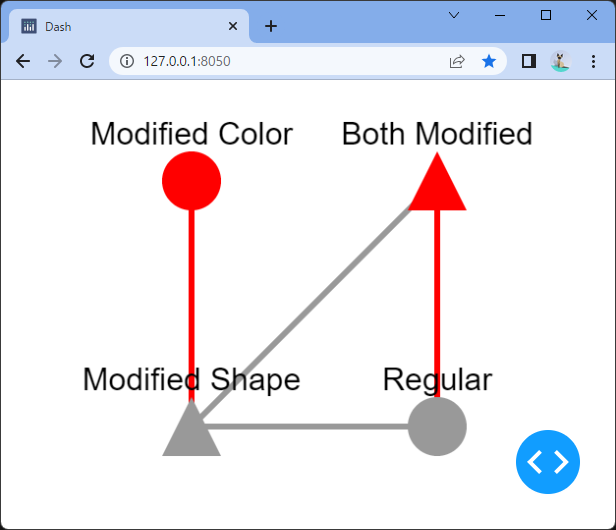
各要素に対して、色や形を指定することができました。

Dash Cytoscape③(ブール型属性)

ブール型属性

ブール型属性を設定すると、ネットワーク図のノードを選択できなくしたり、移動できなくしたりすることができます。

  • locked属性
    Trueを設定すると、移動できなくなる。選択は可能。
  • selected属性
    Trueを設定すると、初期状態で選択された状態になる。他のノードを選択すると非選択状態になる。移動は可能。
  • selectable属性
    Falseを設定すると、選択状態にできなくなる。移動は可能。
  • grabbable属性
    Falseを設定すると、移動できなくなる。選択状態にはできる(?)

[ソースコード]

1
2
3
4
5
6
7
8
9
10
11
12
13
14
15
16
17
18
19
20
21
22
23
24
25
26
27
28
29
30
31
32
33
34
35
36
37
38
39
40
41
42
import dash
import dash_cytoscape as cyto
import dash_html_components as html

app = dash.Dash(__name__)

app.layout = html.Div([
cyto.Cytoscape(
id='cytoscape-elements-boolean',
layout={'name': 'preset'},
style={'width': '100%', 'height': '400px'},
elements=[
{
'data': {'id': 'one', 'label': 'Locked'},
'position': {'x': 75, 'y': 75},
'locked': True
},
{
'data': {'id': 'two', 'label': 'Selected'},
'position': {'x': 75, 'y': 200},
'selected': True
},
{
'data': {'id': 'three', 'label': 'Not Selectable'},
'position': {'x': 200, 'y': 75},
'selectable': False
},
{
'data': {'id': 'four', 'label': 'Not grabbable'},
'position': {'x': 200, 'y': 200},
'grabbable': False
},
{'data': {'source': 'one', 'target': 'two'}},
{'data': {'source': 'two', 'target': 'three'}},
{'data': {'source': 'three', 'target': 'four'}},
{'data': {'source': 'two', 'target': 'four'}},
]
)
])

if __name__ == '__main__':
app.run_server(debug=True)

[ブラウザで表示]

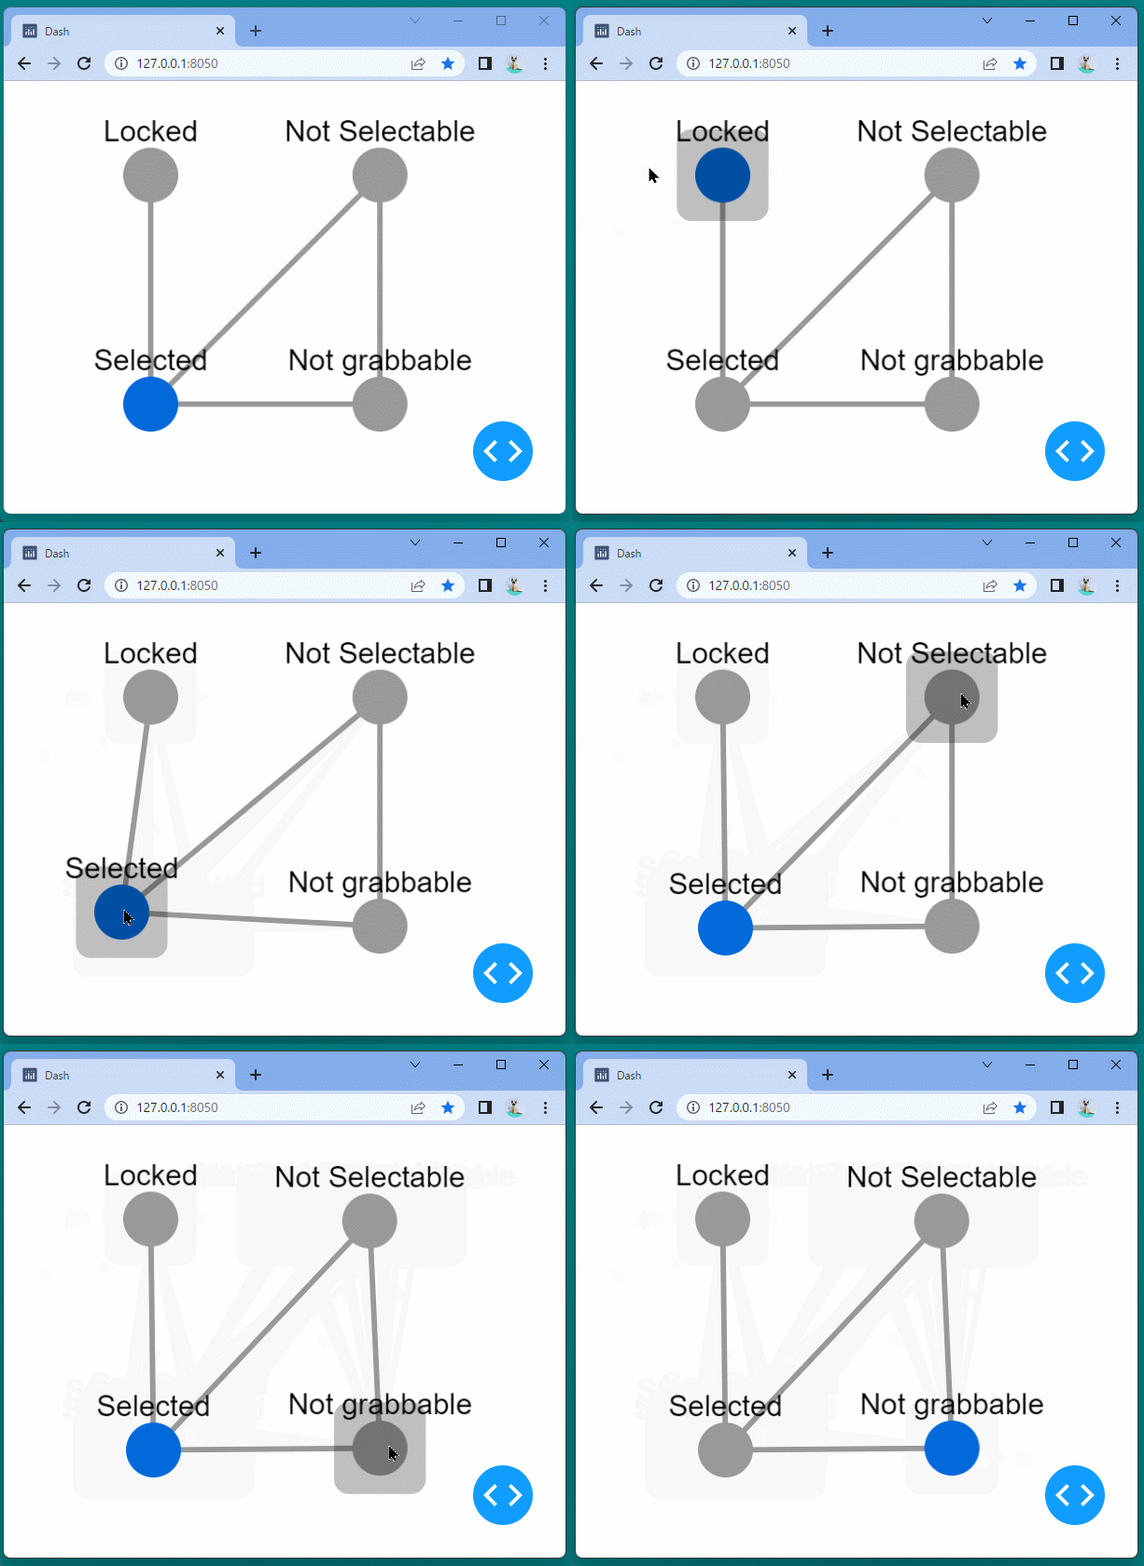
設定した属性値通りに、ノードによって選択できなくなったり、移動できなくなったりしていることが確認できます。

Dash Cytoscape②(基本的なネットワーク図)

基本的なネットワーク図

Dash Cytoscapeを使って、基本的なネットワーク図を描いてみます。

[ソースコード]

1
2
3
4
5
6
7
8
9
10
11
12
13
14
15
16
17
18
19
20
21
import dash
import dash_cytoscape as cyto
import dash_html_components as html

app = dash.Dash(__name__)

app.layout = html.Div([
cyto.Cytoscape(
id='cytoscape-two-nodes',
layout={'name': 'preset'},
style={'width': '100%', 'height': '400px'},
elements=[
{'data': {'id': 'one', 'label': 'Node 1'}, 'position': {'x': 75, 'y': 75}},
{'data': {'id': 'two', 'label': 'Node 2'}, 'position': {'x': 200, 'y': 200}},
{'data': {'source': 'one', 'target': 'two'}}
]
)
])

if __name__ == '__main__':
app.run_server(debug=True)

[ブラウザで表示]

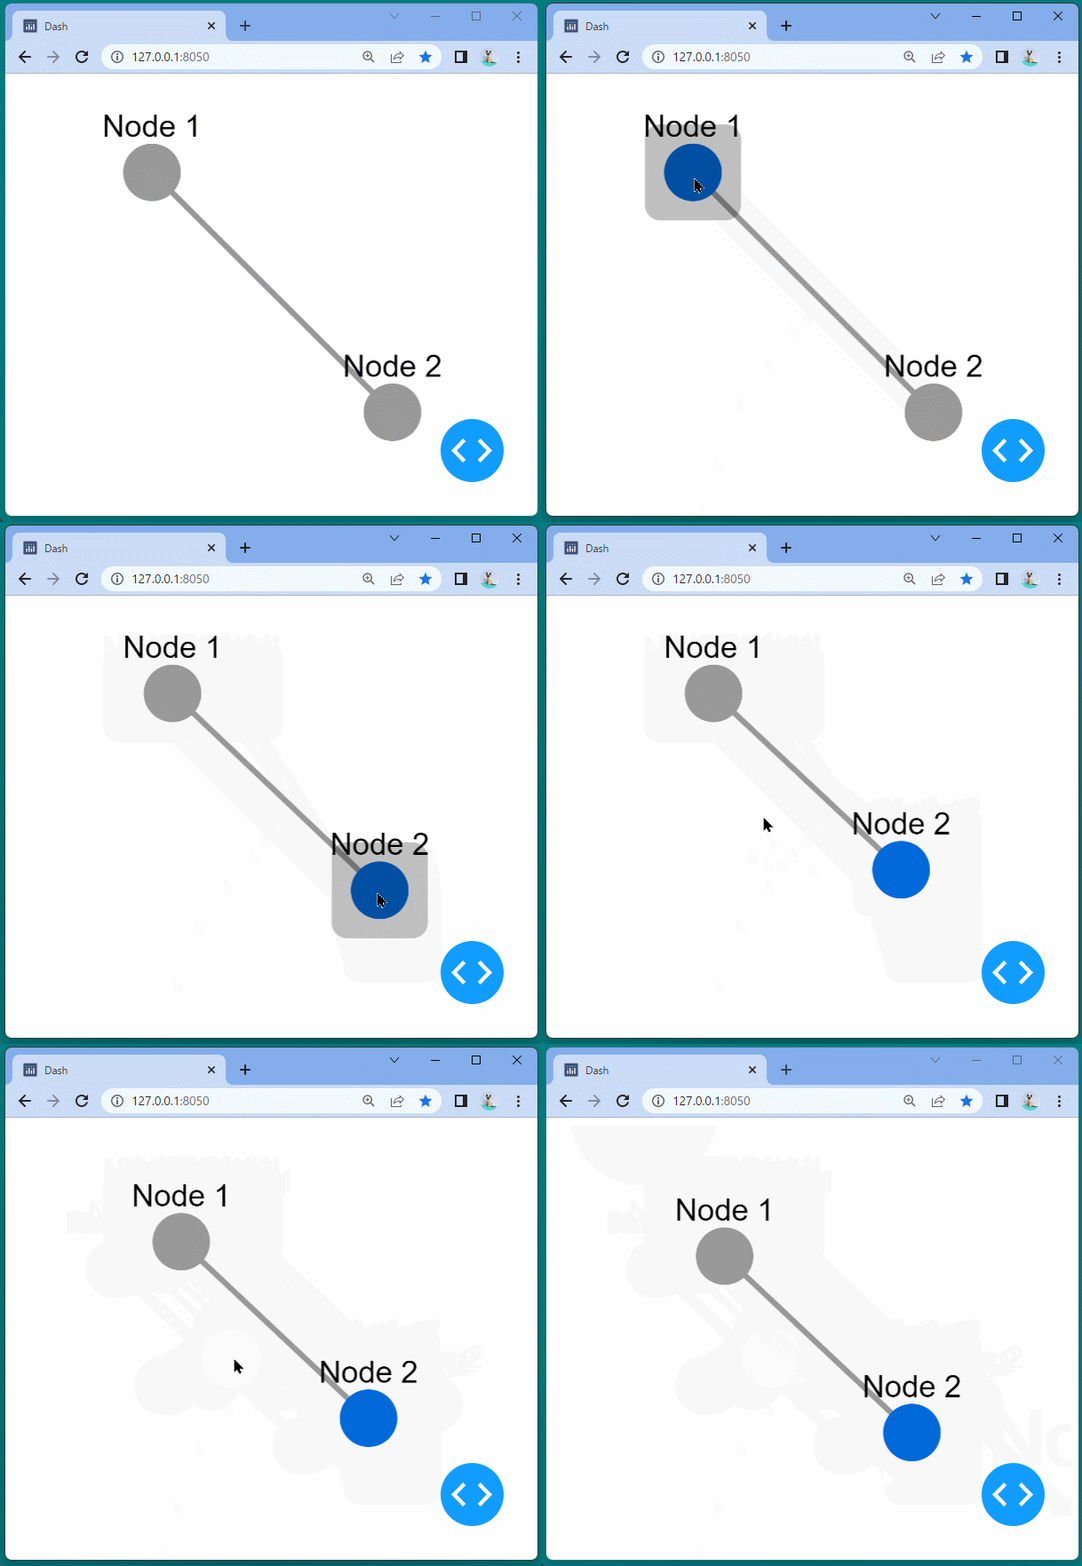
ノードが2つと各ノードをでつないだ基本的なネットワーク図が表示されました。

ノードやノード間の線は選択することができ、ドラッグするとそれぞれの位置を移動することができます。

また、スクロールを行うと拡大・縮小して表示することができます。