A Python Solution for Business Efficiency
Today, I’m diving into an interesting optimization challenge that many businesses face - the staff allocation problem.
This is a classic operations research problem where we need to assign staff to different shifts while minimizing costs and meeting various constraints.
Let’s walk through a concrete example and solve it using $Python$’s optimization libraries.
I’ll show you how to formulate the problem, solve it, and visualize the results.
The Problem Statement
Imagine we manage a call center that needs to be staffed 24/7.
We need to determine how many employees to assign to each shift to ensure we have enough staff to handle the expected call volume while minimizing labor costs.
Here’s our scenario:
- We have 3 shifts: Morning (8am-4pm), Afternoon (4pm-12am), and Night (12am-8am)
- Each shift has different minimum staffing requirements based on call volume
- Each employee can only work one shift per day
- Different shifts have different costs (night shifts cost more)
- We need to minimize the total staffing cost while meeting all requirements
Mathematical Formulation
Let’s define our variables and constraints:
- Let $x_i$ be the number of employees assigned to shift $i$
- Each shift has a minimum staffing requirement $r_i$
- Each shift has an associated cost $c_i$ per employee
- Our objective is to minimize the total cost: $\min \sum_{i} c_i \cdot x_i$
- Subject to: $x_i \geq r_i$ for all $i$ (meeting minimum requirements)
- And $x_i \geq 0$ and integer (non-negative integers)
Python Implementation
Let’s implement this using $PuLP$, a popular linear programming library in $Python$:
1 | import numpy as np |
Code Explanation
Let’s break down the key components of our solution:
1. Problem Setup
We’ve defined a function solve_staff_allocation() that takes two main inputs:
shift_requirements: The minimum number of staff needed for each shiftshift_costs: The cost per employee for each shift
2. Linear Programming Model
- We use $PuLP$ to create a linear programming model with the objective to minimize total cost
- Our decision variables are
staff_vars, representing the number of staff assigned to each shift - We set these as integer variables with a lower bound of 0 (we can’t have negative staff!)
- The objective function is the sum of (cost per employee × number of employees) for each shift
3. Constraints
- For each shift, we add a constraint that the number of assigned staff must be greater than or equal to the minimum requirement
4. Solving and Results
- The model is solved using the CBC solver (a free open-source solver)
- We extract the solution status, total cost, and staff allocation for each shift
Solution Status: Optimal
Total Cost: 2660.0
Staff Allocation:
  Shift_1: 10 employees
  Shift_2: 8 employees
  Shift_3: 5 employees
5. Visualization
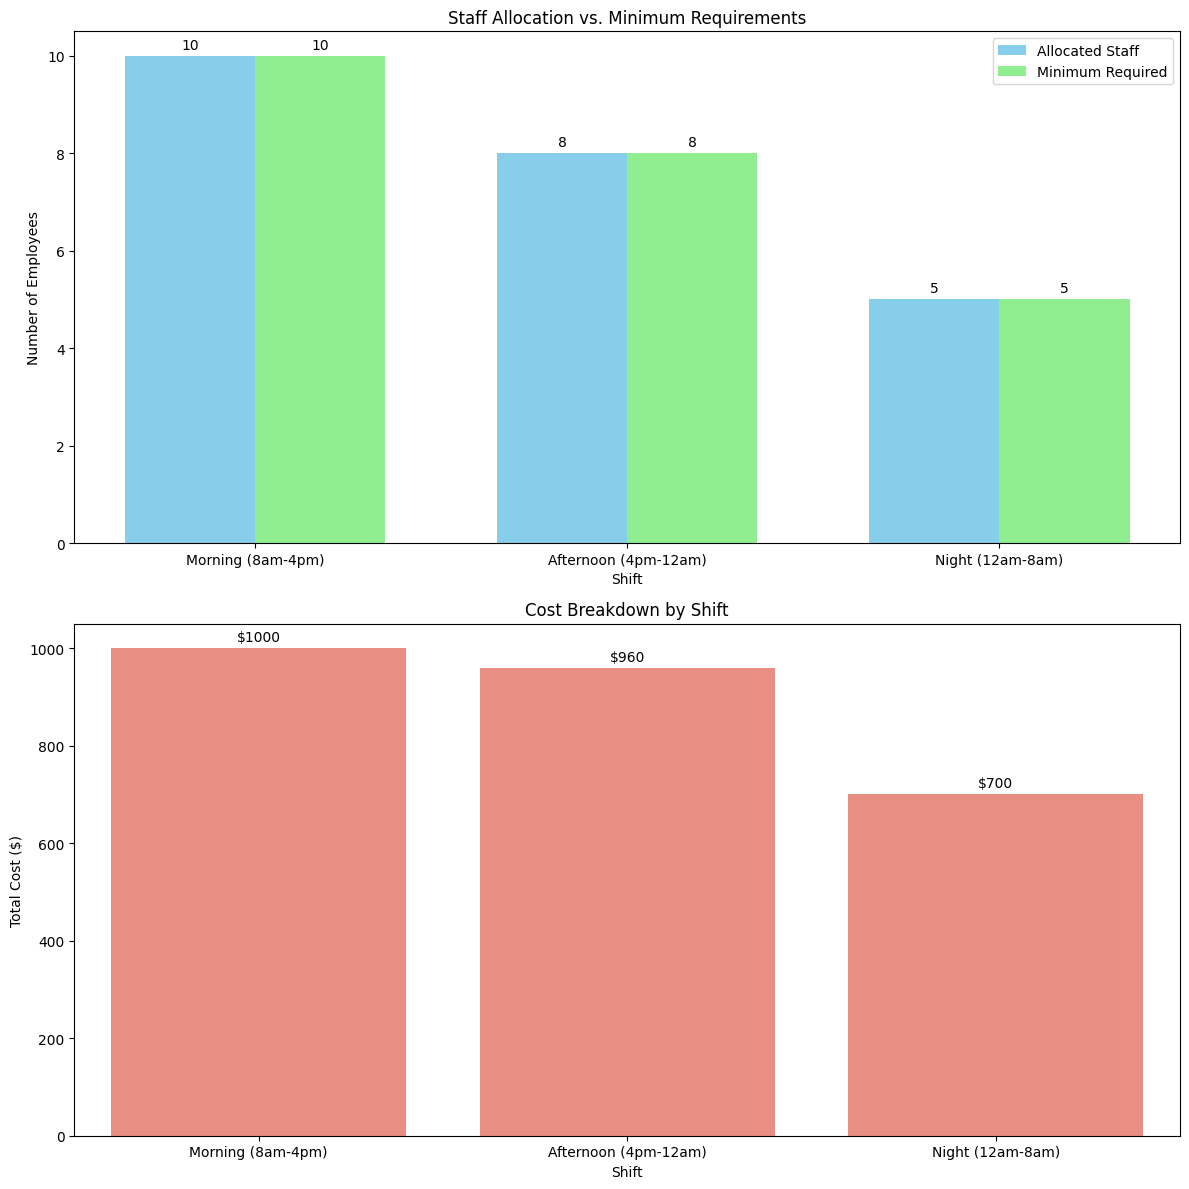
The visualize_solution() function creates two important visualizations:
- A bar chart comparing allocated staff vs. minimum requirements for each shift
- A cost breakdown showing the total cost for each shift
Results Analysis
In our basic scenario:
- Morning shift (8am-4pm): Requires 10 employees, costs $100 each
- Afternoon shift (4pm-12am): Requires 8 employees, costs $120 each
- Night shift (12am-8am): Requires 5 employees, costs $140 each
The optimal solution exactly matches the minimum requirements for each shift, since:
- There’s no benefit to assigning extra staff beyond requirements
- Each shift has a different cost, so we want to assign exactly the minimum needed for the more expensive shifts
The total cost is: (10 × $100) + (8 × $120) + (5 × $140) = $2,660 per day.
Alternative Scenario
I’ve also tested an alternative scenario with different requirements:
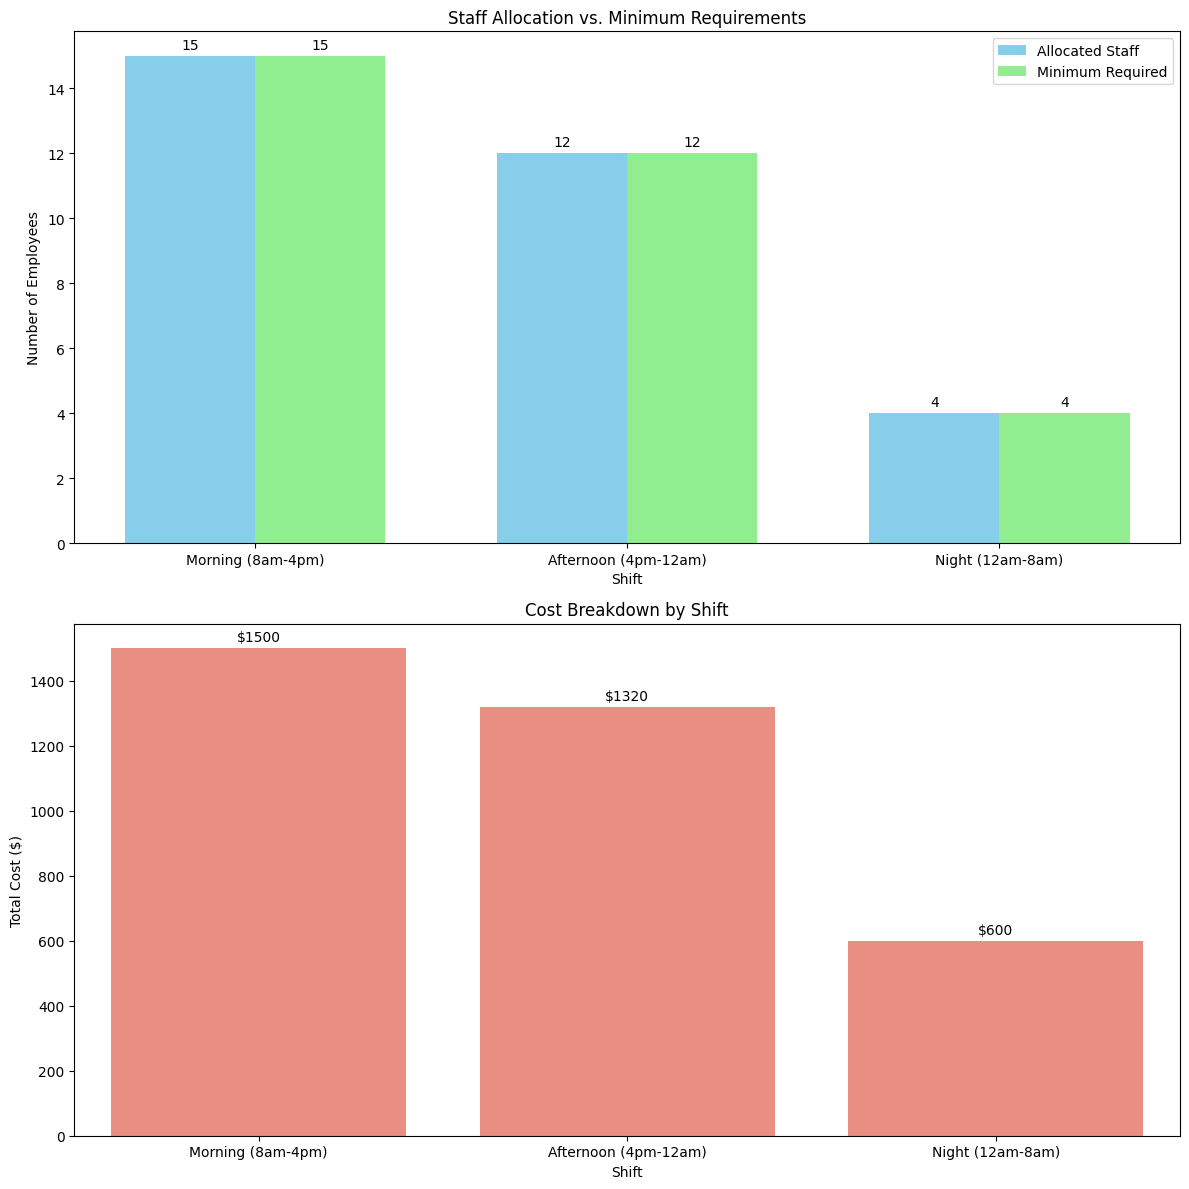
- Higher demand during morning (15) and afternoon (12) shifts
- Lower demand during night shift (4)
- Even higher cost differential for night shift ($150)
This scenario reflects a more typical business where daytime hours are busier.
The solution follows the same pattern - assign exactly the minimum required staff to each shift to minimize costs.
--- Alternative Scenario ---
Solution Status: Optimal
Total Cost: 3420.0
Staff Allocation:
  Shift_1: 15 employees
  Shift_2: 12 employees
  Shift_3: 4 employees
Extending the Model
This basic model can be extended in several ways to make it more realistic:
- Adding constraints on total available staff
- Considering part-time employees
- Including overtime costs
- Adding preferences or restrictions for certain employees
- Considering multi-day scheduling with rest requirements
Conclusion
The staff allocation problem is a practical application of linear programming that can provide significant cost savings for businesses.
By properly formulating the problem and using optimization tools like $PuLP$, we can quickly find optimal staffing solutions even for complex scenarios.
$Python$’s ecosystem makes it easy to not only solve these problems but also to analyze and visualize the results, helping stakeholders understand and implement the solutions.