1
2
3
4
5
6
7
8
9
10
11
12
13
14
15
16
17
18
19
20
21
22
23
24
25
26
27
28
29
30
31
32
33
34
35
36
37
38
39
40
41
42
43
44
45
46
47
48
49
50
51
52
53
54
55
56
57
58
59
60
61
62
63
64
65
66
67
68
69
70
71
72
73
74
75
76
77
78
79
80
81
82
83
84
85
86
87
88
89
90
91
92
93
94
95
96
97
98
99
100
101
102
103
104
105
106
107
108
109
110
111
112
113
114
115
116
117
118
119
120
121
122
123
124
| import dash
import dash_daq as daq
import dash_core_components as dcc
import dash_html_components as html
import plotly.express as px
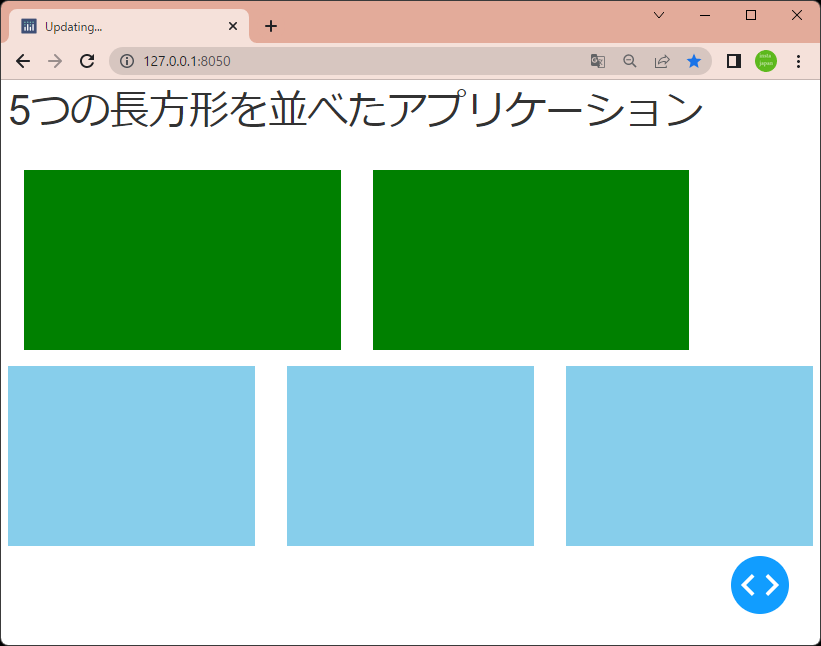
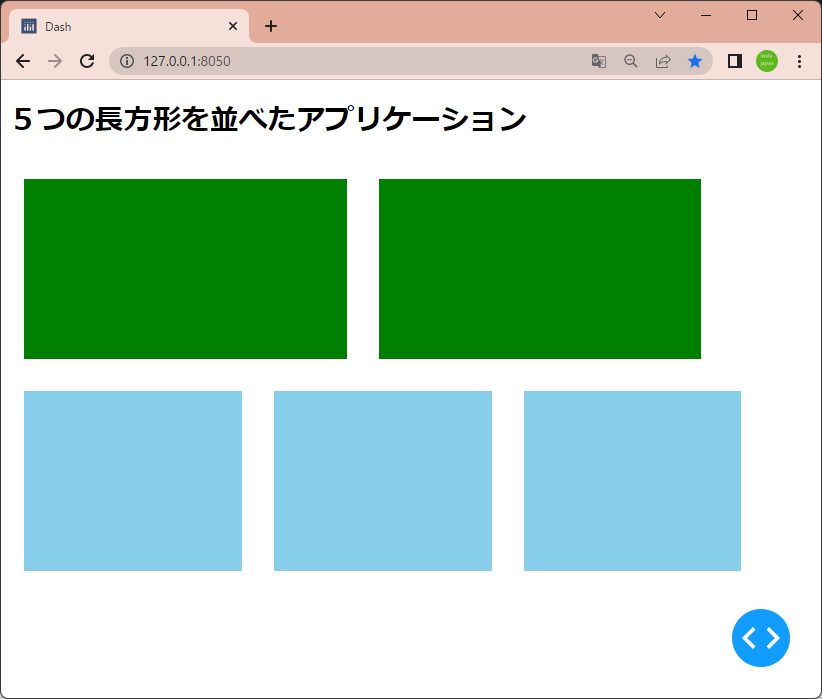
style1 = {
'width':'40%',
'height':'280px',
'backgroundColor':'yello',
'margin':'2%',
'display':'inline-block'
}
style2 = {
'width':'27%',
'height':'280px',
'backgroundColor':'skyblue',
'margin':'2%',
'display':'inline-block'
}
app = dash.Dash(__name__)
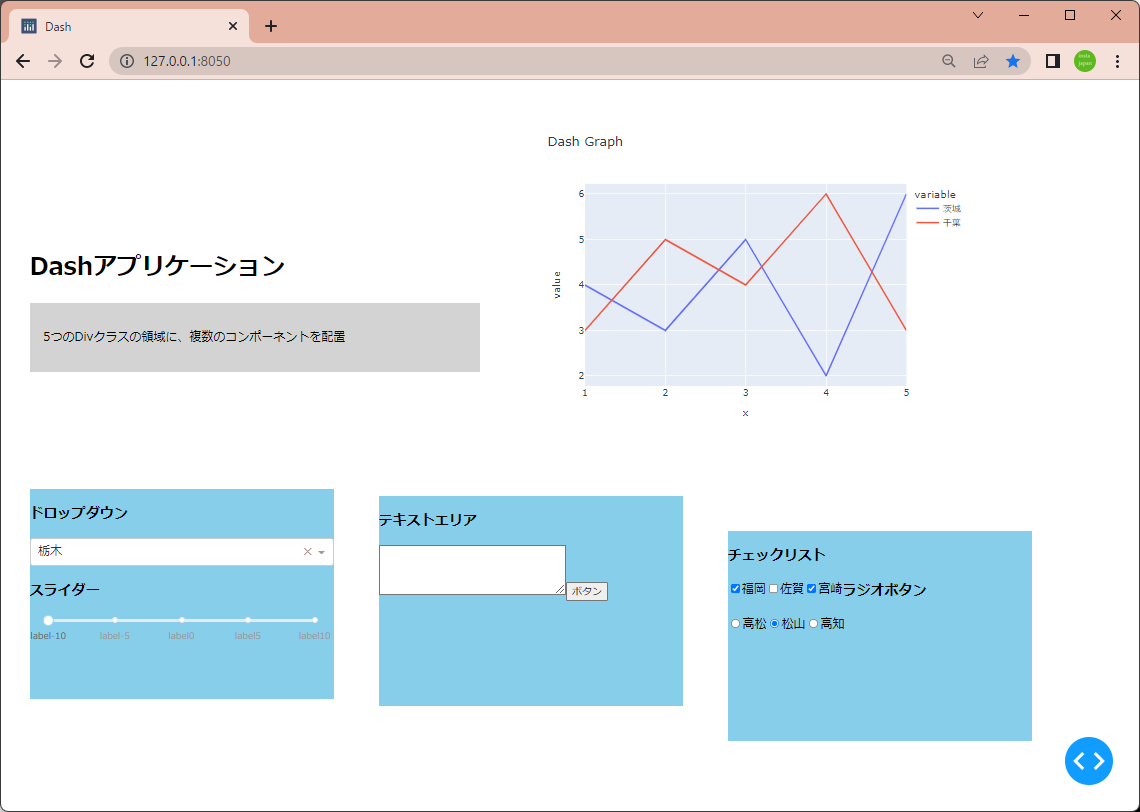
top_left = html.Div(
[
html.H1('Dashアプリケーション'),
dcc.Markdown(
'''
5つのDivクラスの領域に、複数のコンポーネントを配置
''',
style={
'fontsize':20,
'textAlign':'left',
'backgroundColor':'lightgray',
'padding':'3%'
}
)
],
style=style1
)
fig=px.line(
x=[1,2,3,4,5],
y=[[4,3,5,2,6],[3,5,4,6,3]],
title='Dash Graph'
)
fig.data[0].name='茨城'
fig.data[1].name='千葉'
top_right = html.Div(
[
dcc.Graph(
figure=fig
)
],
style=style1
)
buttom_left = html.Div(
[
html.H3('ドロップダウン'),
dcc.Dropdown(
options=[{'label':'埼玉','value':'埼玉'},
{'label':'栃木','value':'栃木'}],
value='栃木'
),
html.H3('スライダー'),
dcc.Slider(min=-10, max=10, marks={i: f'label{i}' for i in range(-10, 11, 5)})
],
style=style2
)
buttom_center = html.Div(
[
html.H3('テキストエリア'),
html.Textarea(style={'height':60, 'width':'60%'}),
html.Button('ボタン')
],
style=style2
)
buttom_right = html.Div(
[
html.H3('チェックリスト'),
dcc.Checklist(
options=[
{'label':'福岡', 'value':'福岡'},
{'label':'佐賀', 'value':'佐賀'},
{'label':'宮崎', 'value':'宮崎'}
],
value=['福岡','宮崎'],
className='five columns'
),
html.H3('ラジオボタン'),
dcc.RadioItems(
options=[
{'label':'高松', 'value':'高松'},
{'label':'松山', 'value':'松山'},
{'label':'高知', 'value':'高知'}
],
value='松山',
className='five columns'
),
],
style=style2
)
app.layout = html.Div(
children=[
html.Div([top_left, top_right]),
html.Div([buttom_left, buttom_center, buttom_right])
]
)
if __name__ == '__main__':
app.run_server(debug=True)
|