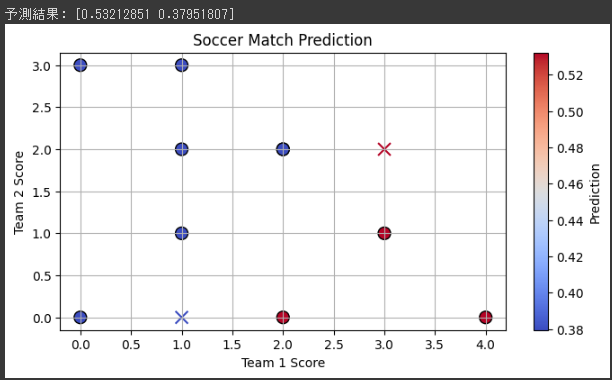
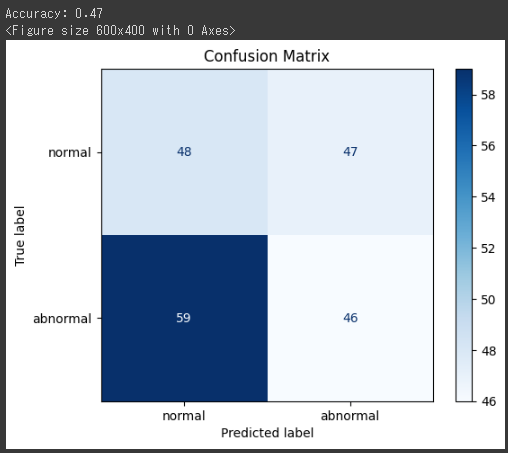
import numpy as np import pandas as pd import matplotlib.pyplot as plt from sklearn.model_selection import train_test_split from sklearn.ensemble import RandomForestClassifier from sklearn.metrics import accuracy_score, confusion_matrix, plot_confusion_matrix
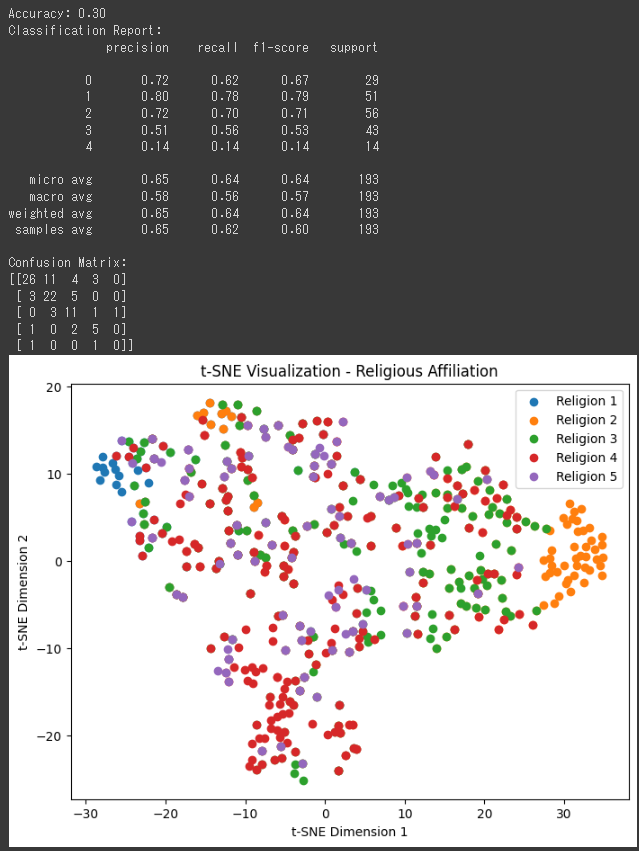
import numpy as np import matplotlib.pyplot as plt from sklearn.datasets import make_multilabel_classification from sklearn.model_selection import train_test_split from sklearn.preprocessing import StandardScaler from sklearn.neighbors import KNeighborsClassifier from sklearn.metrics import accuracy_score, classification_report, confusion_matrix
次に、架空の宗教データを作成します。
1 2 3 4 5 6 7 8 9
# 架空の宗教データを生成 X, y = make_multilabel_classification(n_samples=500, n_features=4, n_classes=5, n_labels=2, random_state=42)
# 特徴量のスケーリング scaler = StandardScaler() X = scaler.fit_transform(X)
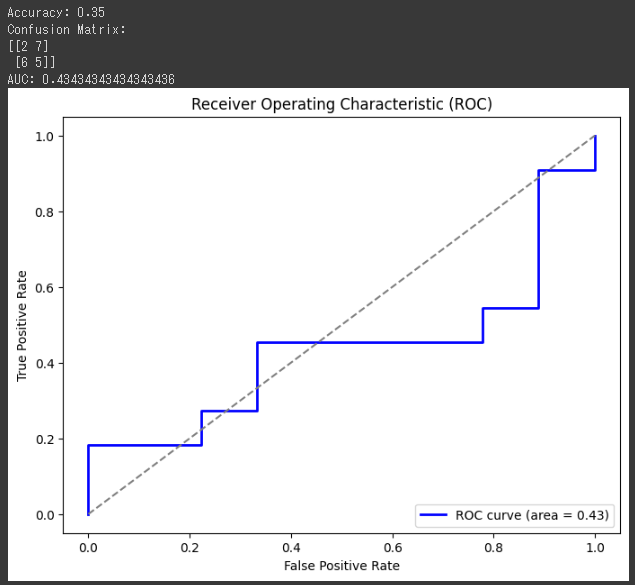
import pandas as pd import numpy as np import matplotlib.pyplot as plt from sklearn.model_selection import train_test_split from sklearn.ensemble import RandomForestClassifier from sklearn.metrics import accuracy_score, confusion_matrix, roc_curve, roc_auc_score
import numpy as np import matplotlib.pyplot as plt from sklearn.model_selection import train_test_split from sklearn.linear_model import LogisticRegression from sklearn.metrics import accuracy_score, confusion_matrix, classification_report
import numpy as np import pandas as pd import matplotlib.pyplot as plt from sklearn.model_selection import train_test_split from sklearn.linear_model import LogisticRegression from sklearn.metrics import confusion_matrix, roc_auc_score, roc_curve
defforward(self, x): x = torch.relu(self.fc1(x)) x = self.fc2(x) return x
次に、訓練データとテストデータを定義します。ここでは、ダミーデータを使用します。
1 2 3 4 5 6
# Dummy data train_features = torch.rand(100, 3) # 100 recipes, 3 features each train_ratings = torch.randint(1, 6, (100, 1)).float() # ratings from 1 to 5
test_features = torch.rand(20, 3) # 20 recipes, 3 features each test_ratings = torch.randint(1, 6, (20, 1)).float() # ratings from 1 to 5
net = Net() criterion = nn.MSELoss() optimizer = optim.SGD(net.parameters(), lr=0.01)
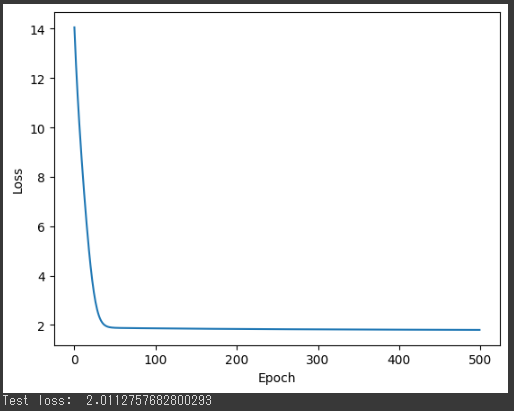
# Store losses for plotting losses = []
for epoch inrange(500): # number of epochs optimizer.zero_grad() outputs = net(train_features) loss = criterion(outputs, train_ratings) loss.backward() optimizer.step()
losses.append(loss.item())
# Plot the loss over time plt.plot(losses) plt.xlabel('Epoch') plt.ylabel('Loss') plt.show()
最後に、テストデータを使用してネットワークの性能を評価します。
1 2 3 4 5
with torch.no_grad(): predictions = net(test_features) loss = criterion(predictions, test_ratings)