Dash㊺(Tabコンポーネント)

Tabコンポーネント

Tabコンポーネントを使うと、画面遷移せずに画面を切り替えて表示することができます。

今回は、単純に2つのタブを切り替えるアプリケーションを作成してみます。

Tabsコンポーネントのchildren属性に、複数のTabコンポーネントを設定しタブごとのコンテンツを設定します。

[ソースコード]

1
2
3
4
5
6
7
8
9
10
11
12
13
14
15
16
import dash
import dash_core_components as dcc
import dash_html_components as html

app = dash.Dash(__name__) # Dashインスタンスを生成

app.layout = dcc.Tabs(
value="one", # 初期選択タブ
children=[
dcc.Tab(label='タブ1', value="one", children=html.H3('タブ1の内容')),
dcc.Tab(label='タブ2', value="two", children=html.H3('タブ2の内容'))
]
)

if __name__ == '__main__':
app.run_server(debug=True) # アプリケーションを起動

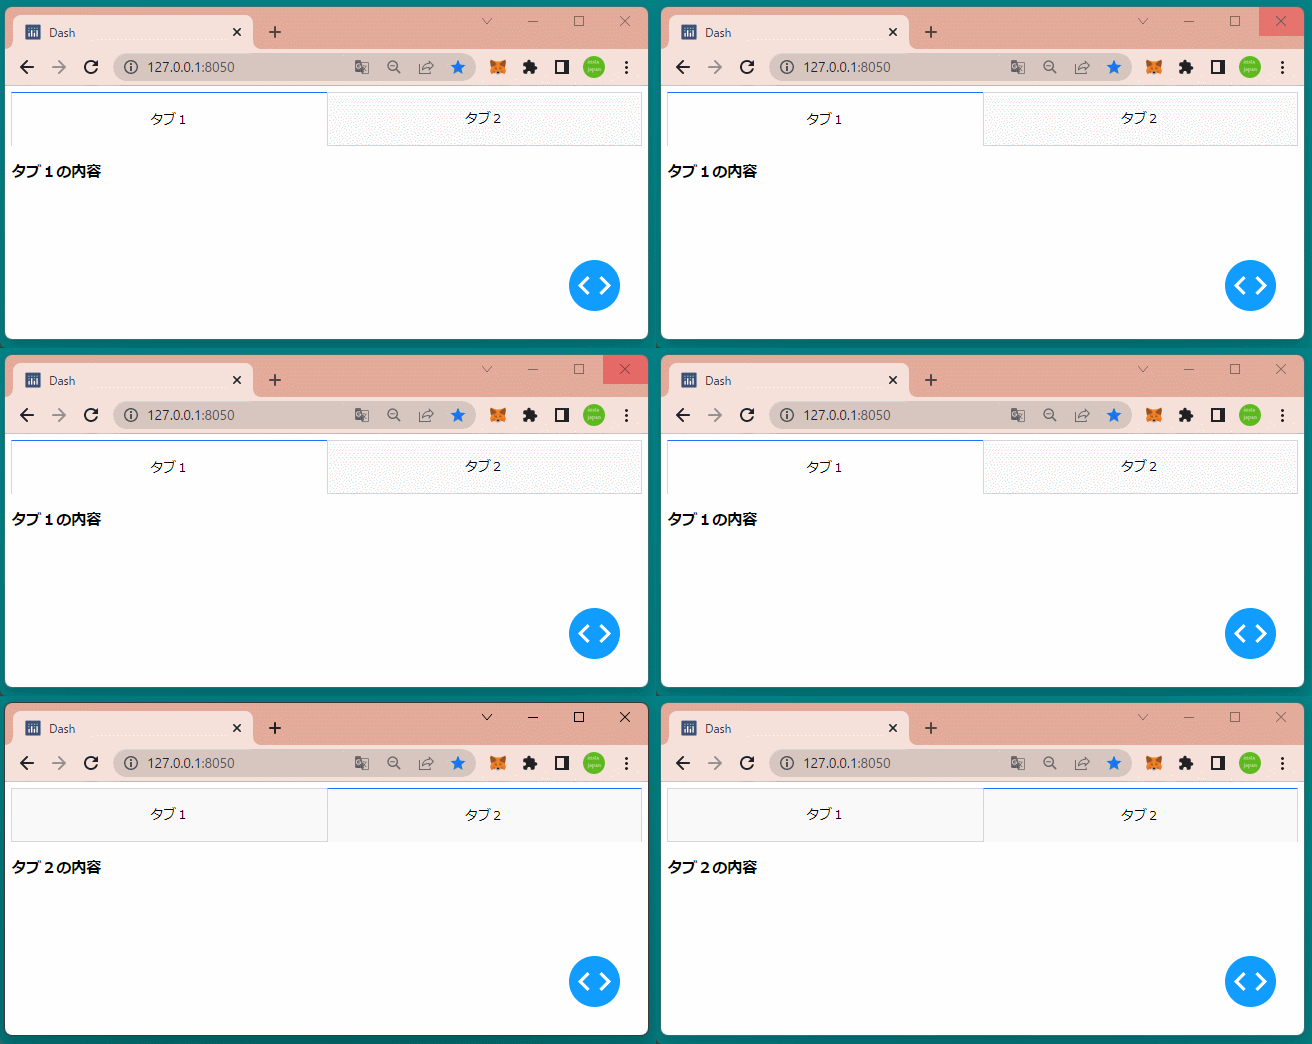
初期画面には、Tabsコンポーネントのvalue属性に設定されたコンテンツ(タブ)が選択された状態で表示されます。

[ブラウザで表示]

タブをクリックすることで表示されるコンテンツが切り替わることが確認できます。

Dash㊹(Uploadコンポーネント その3)

グラフ表示

前回記事で、Upload関数を使ってファイルをアップロードし、そのファイルの内容をテーブルに表示しました。

今回はアップロードしたファイルの内容をグラフに表示してみます。

前回同様read_csv関数を使ってCSVファイルを読み込みんでDataFrameを作成します。

そのDataFrameplotlyのline関数を使って折れ線グラフに表示します。(60行目)

[ソースコード]

1
2
3
4
5
6
7
8
9
10
11
12
13
14
15
16
17
18
19
20
21
22
23
24
25
26
27
28
29
30
31
32
33
34
35
36
37
38
39
40
41
42
43
44
45
46
47
48
49
50
51
52
53
54
55
56
57
58
59
60
61
62
63
64
65
import io,  base64
import pandas as pd

import dash
import dash_table
import dash_core_components as dcc
import dash_html_components as html
import plotly.graph_objects as go
import plotly.express as px
from dash.dependencies import Input, Output, State


app = dash.Dash(__name__) # Dashインスタンスを生成

app.layout = html.Div(
[
dcc.Upload(
id='upload1',
children=html.Div(['Drag and Drop or ', html.A('Select CSV or Excel File')]),
style={
'width':'80%',
'height':'50px',
'lineHeight':'60px',
'borderWidth':'1px',
'borderStyle':'dashed',
'borderRadius':'5px',
'textAlign':'center',
'margin':'5% auto',
}
),
html.H3(id='filename1', style={'textAlign':'center'}),
html.H3(id='content1', style={'textAlign':'center'}),
html.Div(id='table1'), # テーブル表示用
html.Div(id='graph1'), # グラフ表示用
]
)

# コールバックの定義
@app.callback(
Output('filename1', 'children'),
Output('content1', 'children'),
Output('table1', 'children'), # テーブル表示用
Output('graph1', 'children'), # グラフ表示用
Input('upload1', 'filename'),
Input('upload1', 'contents')
)
def update_content(filename, contents):
decoded = None
table1 = None
graph1 = None
if contents:
content_type, content_string = contents.split(',')
decoded = base64.b64decode(content_string)

# CSVファイルの内容をテーブルに設定
df = pd.read_csv(io.StringIO(decoded.decode('utf-8')))
table1 = dash_table.DataTable(data=df.to_dict('records'),
columns=[{'name':i, 'id':i} for i in df.columns])
# CSVファイルの内容をグラフに設定
graph1 = dcc.Graph(figure=px.line(df, x='col1', y='col2'))

return 'Filename:{}'.format(filename), 'Contents:{}'.format(decoded), table1, graph1

if __name__ == '__main__':
app.run_server(debug=True) # アプリケーションを起動

下記のCSVファイルをアップロードしてみます。

[data.csv]

1
2
3
4
5
6
7
col1,col2
1,2
2,5
3,1
4,3
5,2
6,3

[ブラウザで表示]

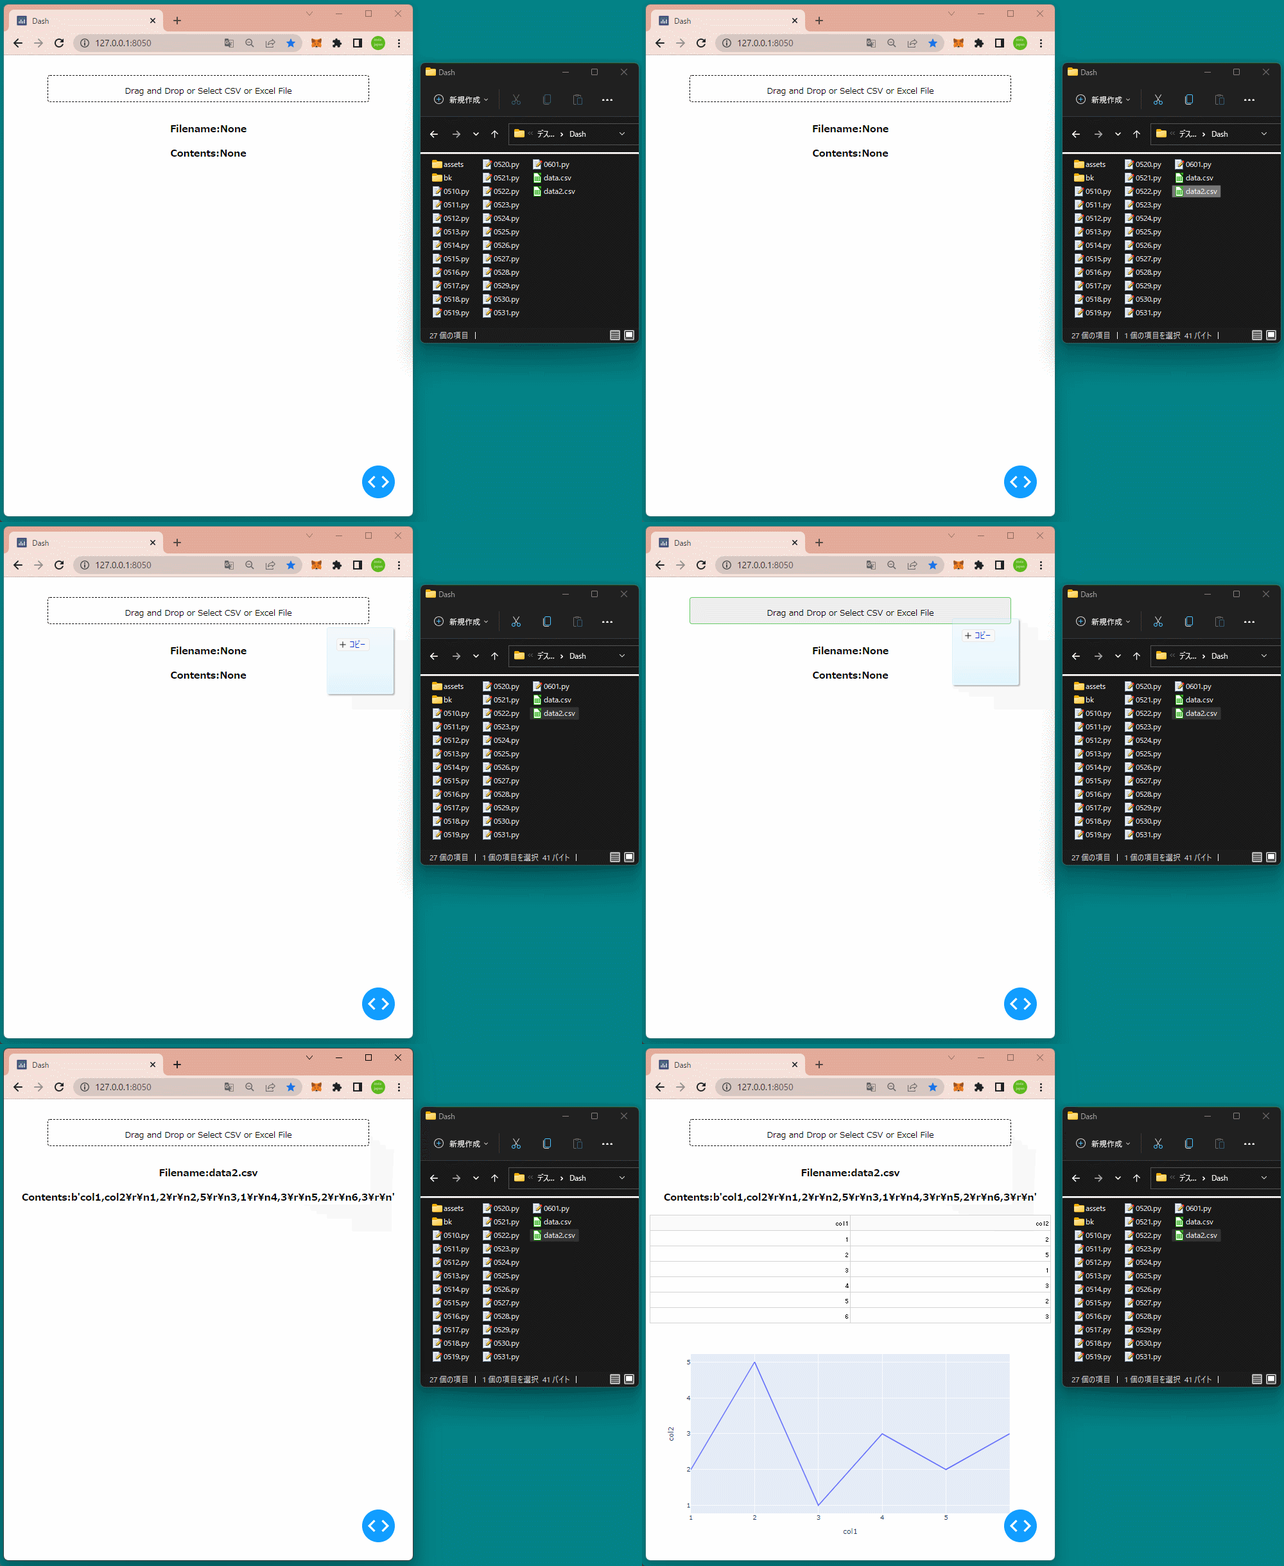
CSVファイルをUploadコンポーネントにドラッグ&ドロップすると、そのファイル内容がグラフに表示されることを確認できます。

Dash㊸(Uploadコンポーネント その2)

テーブル表示

前回記事で、Upload関数を使ってファイルをアップロードし、そのファイル名とファイルの内容を取得しました。

今回はアップロードしたファイルの内容をテーブルに表示してみます。

CSVファイルの読み込みは、read_csv関数を使いDataFrameを作成します。(54行目)

[ソースコード]

1
2
3
4
5
6
7
8
9
10
11
12
13
14
15
16
17
18
19
20
21
22
23
24
25
26
27
28
29
30
31
32
33
34
35
36
37
38
39
40
41
42
43
44
45
46
47
48
49
50
51
52
53
54
55
56
57
58
59
60
61
import io,  base64
import pandas as pd

import dash
import dash_table
import dash_core_components as dcc
import dash_html_components as html
import plotly.graph_objects as go
from dash.dependencies import Input, Output, State


app = dash.Dash(__name__) # Dashインスタンスを生成

app.layout = html.Div(
[
dcc.Upload(
id='upload1',
children=html.Div(['Drag and Drop or ', html.A('Select CSV or Excel File')]),
style={
'width':'80%',
'height':'50px',
'lineHeight':'60px',
'borderWidth':'1px',
'borderStyle':'dashed',
'borderRadius':'5px',
'textAlign':'center',
'margin':'5% auto',
}
),
html.H3(id='filename1', style={'textAlign':'center'}),
html.H3(id='content1', style={'textAlign':'center'}),
html.Div(id='table1'), # テーブル表示用
]
)

# コールバックの定義
@app.callback(
Output('filename1', 'children'),
Output('content1', 'children'),
Output('table1', 'children'), # テーブル表示用
Input('upload1', 'filename'),
Input('upload1', 'contents')
)
def update_content(filename, contents):
print(filename)
print(contents)
decoded = None
table1 = None
if contents:
content_type, content_string = contents.split(',')
decoded = base64.b64decode(content_string)

# CSVファイルの内容をテーブルに設定
df = pd.read_csv(io.StringIO(decoded.decode('utf-8')))
table1 = dash_table.DataTable(data=df.to_dict('records'),
columns=[{'name':i, 'id':i} for i in df.columns])

return 'Filename:{}'.format(filename), 'Contents:{}'.format(decoded), table1

if __name__ == '__main__':
app.run_server(debug=True) # アプリケーションを起動

下記のCSVファイルをアップロードしてみます。

[data.csv]

1
2
a,b,c,d,e
1,2,3,4,5

[ブラウザで表示]

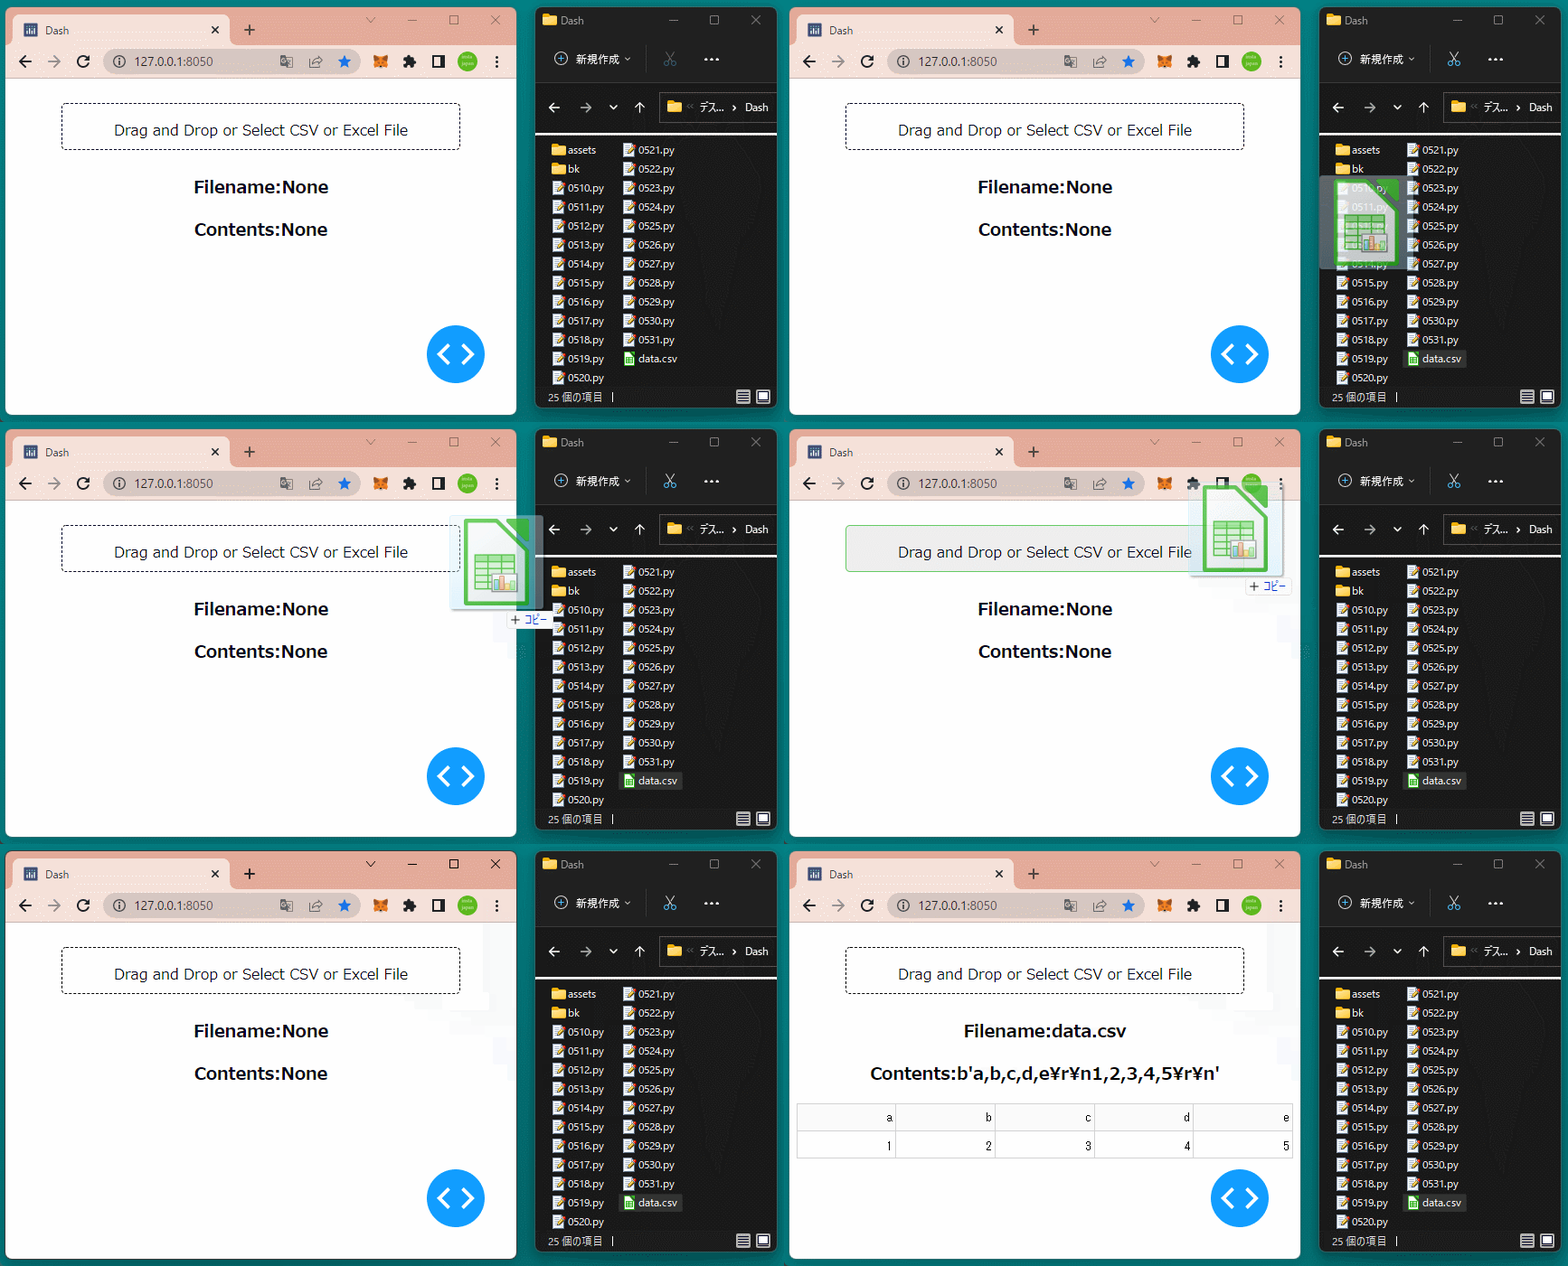
CSVファイルをUploadコンポーネントにドラッグ&ドロップすると、そのファイル名とファイル内容が表示され、さらにファイルの内容がテーブルに表示されていることを確認できます。

Dash㊷(Uploadコンポーネント)

Uploadコンポーネント

Uploadコンポーネントを使うと、ファイルをアップロードすることができます。

CSVファイルをアップロードして、そのファイル名とCSVファイルの内容を表示するアプリケーションを作成します。

Uploadコンポーネントには、スタイル設定を行いコンポーネントの境界に点線を描画し、ファイルアップロードのための領域を表示しています。

[ソースコード]

1
2
3
4
5
6
7
8
9
10
11
12
13
14
15
16
17
18
19
20
21
22
23
24
25
26
27
28
29
30
31
32
33
34
35
36
37
38
39
40
41
42
43
44
45
46
47
48
49
50
51
import base64
import pandas as pd

import dash
import dash_core_components as dcc
import dash_html_components as html
import plotly.graph_objects as go
from dash.dependencies import Input, Output, State


app = dash.Dash(__name__) # Dashインスタンスを生成

app.layout = html.Div(
[
dcc.Upload(
id='upload1',
children=html.Div(['Drag and Drop or ', html.A('Select CSV or Excel File')]),
style={
'width':'80%',
'height':'50px',
'lineHeight':'60px',
'borderWidth':'1px',
'borderStyle':'dashed',
'borderRadius':'5px',
'textAlign':'center',
'margin':'5% auto',
}
),
html.H3(id='filename1', style={'textAlign':'center'}),
html.H3(id='content1', style={'textAlign':'center'}),
#dcc.Graph(id='graph1'),
]
)

# コールバックの定義
@app.callback(
Output('filename1', 'children'),
Output('content1', 'children'),
Input('upload1', 'filename'),
Input('upload1', 'contents')
)
def update_content(filename, contents):
decoded = None
if contents:
content_type, content_string = contents.split(',')
decoded = base64.b64decode(content_string)

return 'Filename:{}'.format(filename), 'Contents:{}'.format(decoded)

if __name__ == '__main__':
app.run_server(debug=True) # アプリケーションを起動

下記のCSVファイルをアップロードしてみます。

[data.csv]

1
2
a,b,c,d,e
1,2,3,4,5

[ブラウザで表示]

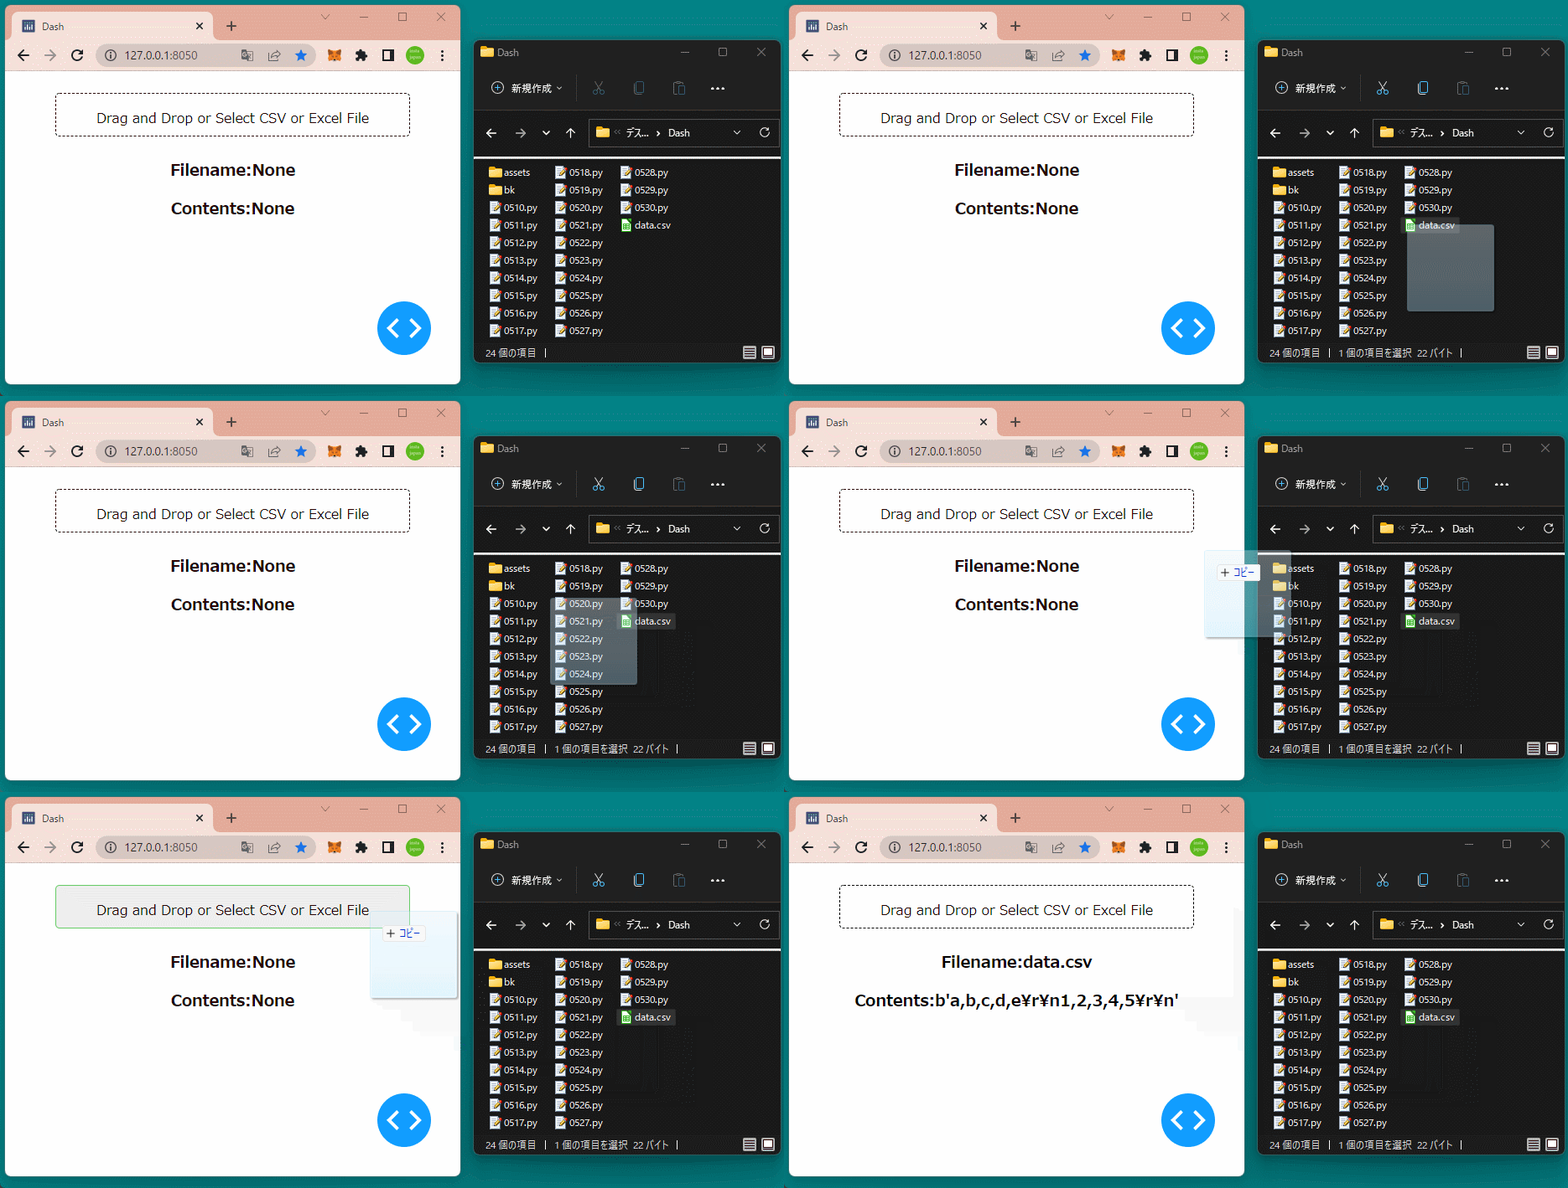
CSVファイルをUploadコンポーネントにドラッグ&ドロップすると、そのファイル名とファイル内容を表示できることが確認できます。

Dash㊶(Intervalコンポーネント)

Intervalコンポーネント

Intervalコンポーネントを使うと、定期的にコールバックを実行することができます。

Intervalコンポーネントinterval属性更新間隔(ミリ秒)を設定します。

またn_intervals属性を参照し、実行回数を確認することができます。

Intervalクラスの設定値は次の通りです。

オプション データ型 内容
interval 数値 更新間隔をミリ秒単位で設定。
デフォルト値は1000。
disabled ブール型 Trueの場合、コンポーネントを更新しない。
n_intervals 数値 更新回数。
デフォルト値は0。
max_intervals 数値 更新回数の上限。指定回数で更新が止まる。
デフォルト値は-1で、無制限に更新される。

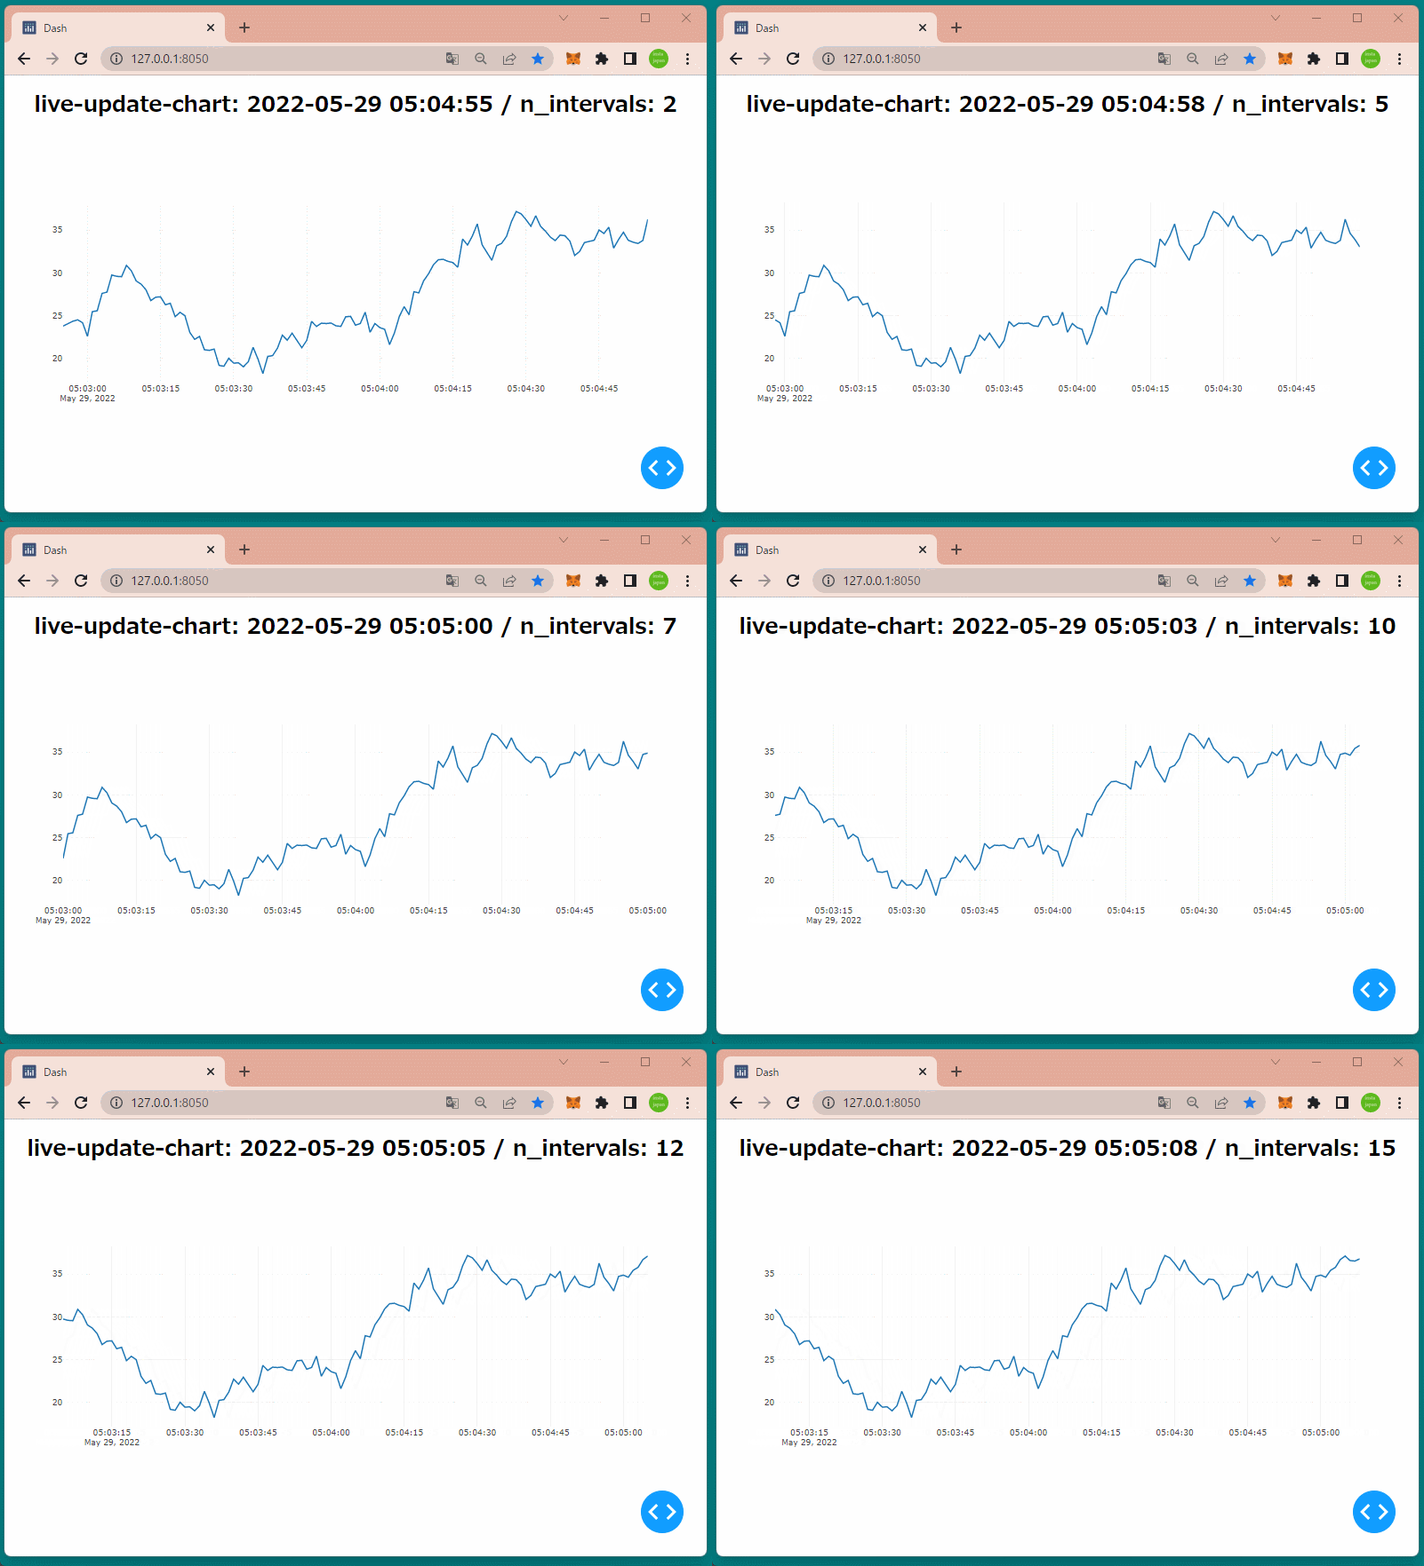
今回はIntervalコンポーネントを使って、乱数で生成したデータを1秒ごとにグラフに反映するアプリケーションを作成します。

[ソースコード]

1
2
3
4
5
6
7
8
9
10
11
12
13
14
15
16
17
18
19
20
21
22
23
24
25
26
27
28
29
30
31
32
33
34
35
36
37
38
39
40
41
42
43
44
45
import datetime
import numpy as np
import pandas as pd

import dash
import dash_core_components as dcc
import dash_html_components as html
import plotly.graph_objects as go
from dash.dependencies import Input, Output

start = pd.Timestamp(datetime.datetime.now()).round("s") - datetime.timedelta(seconds=300)

df = pd.DataFrame(
{'price':np.random.randn(1000).cumsum()},
index=pd.date_range(start, freq='s', periods=1000)
)


app = dash.Dash(__name__) # Dashインスタンスを生成

app.layout = html.Div(
[
html.H1(id='title1', style={'textAlign':'center'}),
dcc.Graph(id='graph1'),
dcc.Interval(id='interval1', interval=1000, max_intervals=100)
]
)

# コールバックの定義
@app.callback(
Output('title1', 'children'),
Output('graph1', 'figure'),
Input('interval1', 'n_intervals')
)
def update(n_intervals):
now = pd.Timestamp(datetime.datetime.now()).round('s')
past = now - datetime.timedelta(seconds=120)
plot_df = df.loc[past:now]
return (
'live-update-chart: {} / n_intervals: {}'.format(now, n_intervals),
{'data': [go.Scatter(x=plot_df.index, y=plot_df['price'])]}
)

if __name__ == '__main__':
app.run_server(debug=True) # アプリケーションを起動

コールバックの入力項目にn_interval属性を設定し、一定間隔でアプリケーションを更新しています。

[ブラウザで表示]

1秒ごとにグラフのデータが更新されていることを確認できます。

Dash㊵(Locationコンポーネント)

Locationコンポーネント

Locationコンポーネントは、アドレスバーの役割を担います。

コールバックと合わせて使用することで、アドレスバーLinkコンポーネントで指定されたパス(URL)に応じたコンテンツ(ページ)を表示することができます。

ローケーションの設定値は次の通りです。

オプション データ型 内容
hash 文字列 URLの#以降の部分
href 文字列 URLの全体
pathname 文字列 URLのパス名
refresh ブール型 ロケーションが更新された場合に、ページを更新するかどうか。
デフォルトはTrue。
search 文字列 URLのサーチ部分

コンポーネントの役割を確認するために、Locationコンポーネントの属性値を表示するアプリケーションを作成します。

[ソースコード]

1
2
3
4
5
6
7
8
9
10
11
12
13
14
15
16
17
18
19
20
21
22
23
24
25
26
27
28
29
30
31
32
33
34
35
36
37
38
39
40
41
42
43
44
45
46
47
import dash
import dash_core_components as dcc
import dash_html_components as html
from dash.dependencies import Input, Output

app = dash.Dash(__name__) # Dashインスタンスを生成

app.layout = html.Div(
[
dcc.Location(id='dcc_location'),
html.Div(id='location1'),
html.Div(id='location2'),
html.Div(id='location3'),
html.Div(id='location4'),
html.Br(),
dcc.Link('/test', href='/test'),
html.Br(),
dcc.Link('/test?what', href='/test?what'),
html.Br(),
dcc.Link('/test?what#dashhash', href='/test?what#dashhash'),
html.Br(),
dcc.Link('home', href='/')
],
style={'fontSize':30, 'textAlign':'center'}
)

# コールバックの定義
@app.callback(
Output('location1', 'children'),
Output('location2', 'children'),
Output('location3', 'children'),
Output('location4', 'children'),
Input('dcc_location', 'href'),
Input('dcc_location', 'pathname'),
Input('dcc_location', 'search'),
Input('dcc_location', 'hash'),
)
def update_location(url, pathname, search, hash):
return (
'href={}'.format(url),
'pathname={}'.format(pathname),
'search={}'.format(search),
'hash={}'.format(hash)
)

if __name__ == '__main__':
app.run_server(debug=True) # アプリケーションを起動

[ブラウザで表示]

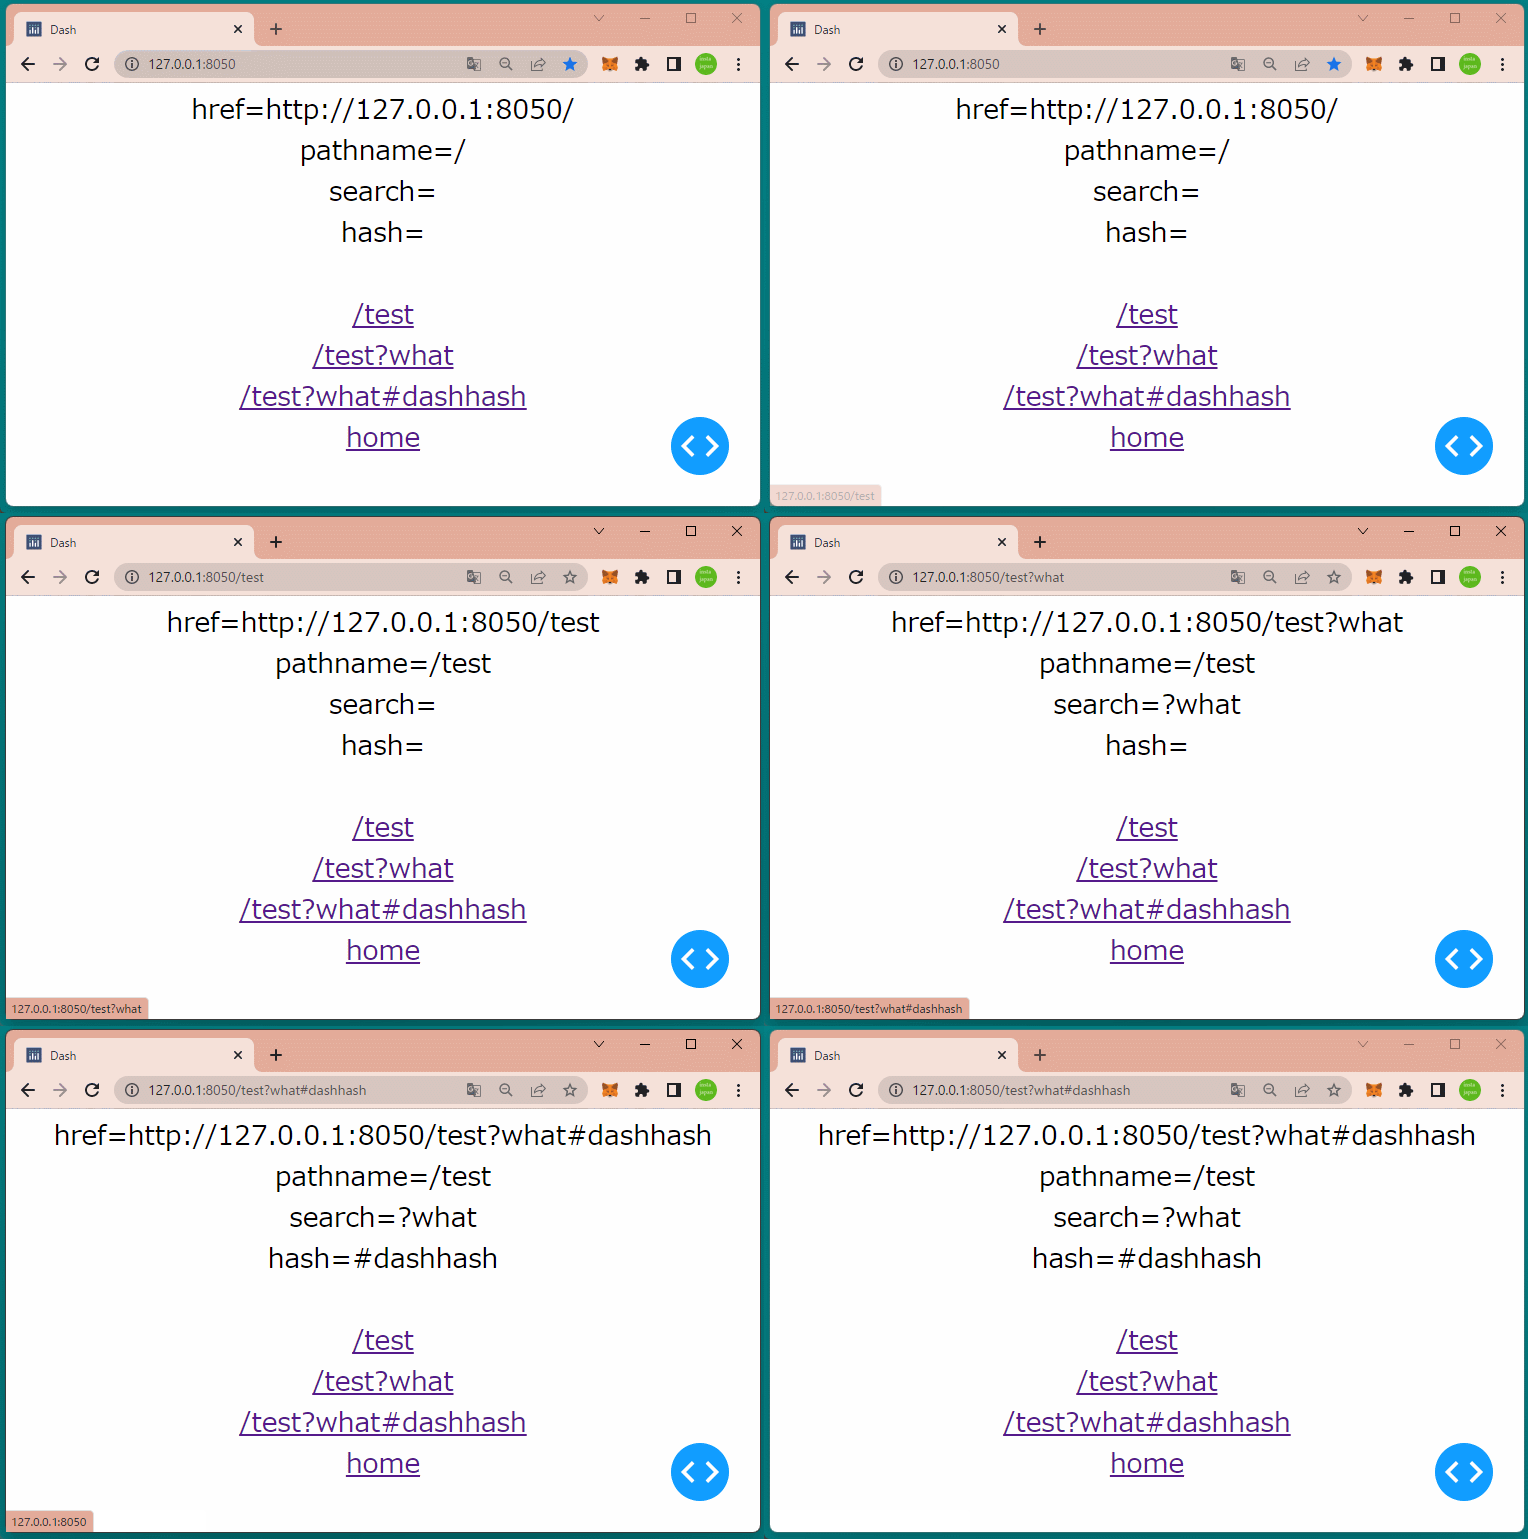
初期画面としては、href属性pathname属性の値が表示されます。

/test?what#dashhashをクリックすると、search属性hash属性が表示されます。

複数ページのアプリケーションを実現するには、LocationコンポーネントLinkコンポーネントコールバックを組み合わせることになります。

Dash㊴(Linkコンポーネント)

Linkコンポーネント

Linkコンポーネントを使うと、他ページへのリンクを作成することができます。

リンクの設定値は次の通りです。

オプション データ型 内容
第一引数 文字列 ハイパーリンクを設定。
href 文字列 リンク先のURLを設定。
refresh ブール型 リンクをクリックした時にページを更新するかどうか。
デフォルトはFalse。

今回は、リンクが3つあるアプリケーションを作成します。

[ソースコード]

1
2
3
4
5
6
7
8
9
10
11
12
13
14
15
16
17
18
19
20
21
22
23
24
25
26
27
28
29
30
31
32
33
34
35
36
37
38
39
40
41
42
43
44
import dash
import dash_core_components as dcc
import dash_html_components as html
from dash.dependencies import Input, Output

app = dash.Dash(__name__) # Dashインスタンスを生成

app.layout = html.Div(
[
dcc.Location(id='location1'),
html.Br(),
dcc.Link('/test1', href='/test1'),
html.Br(),
dcc.Link('/test2', href='/test2'),
html.Br(),
dcc.Link('/test3', href='/test3'),
html.Br(),
html.Br(),
html.Div(
id='div1',
style={'fontSize':'40', 'textAlign':'center', 'height':350}
)
],
style={'fontSize':'40', 'textAlign':'center'}
)

# コールバックの定義
@app.callback(
Output('div1', 'children'),
Input('location1', 'pathname')
)
def update_location(pathname):
# pathnameごとにコンテンツを返す
if pathname == '/test1':
return html.H1('test1のページ')
elif pathname == '/test2':
return html.H2('test2のページ')
elif pathname == '/test3':
return html.H3('test3のページ')
else:
return '初期画面'

if __name__ == '__main__':
app.run_server(debug=True) # アプリケーションを起動

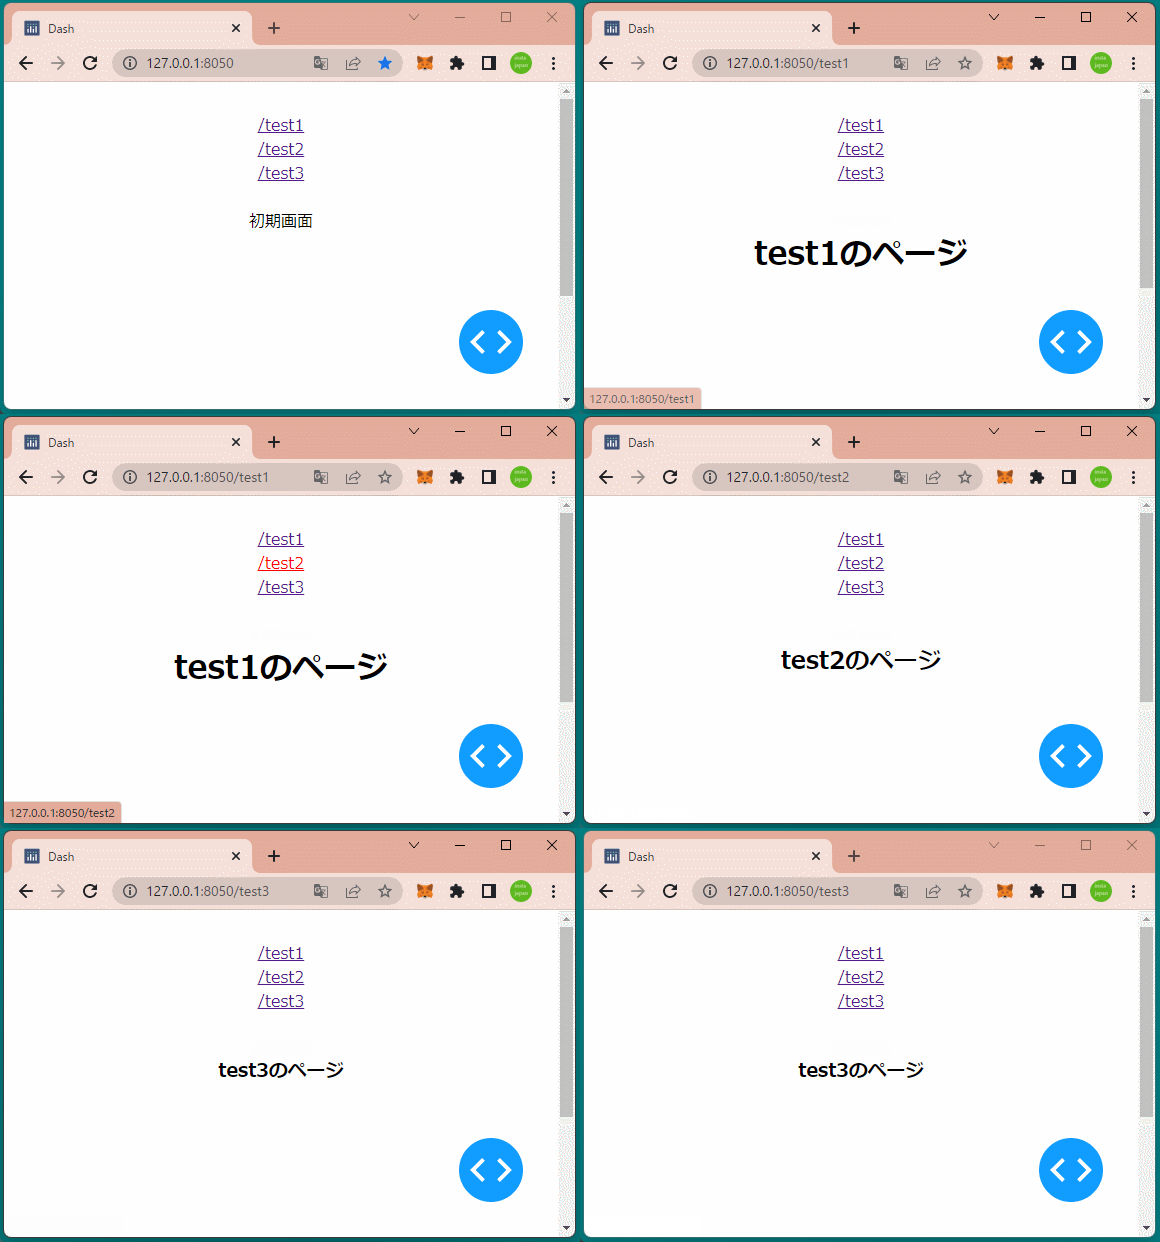
コールバック関数では、クリックされたリンクに応じてDivコンポーネントに文字列を設定しています。

[ブラウザで表示]

リンクをクリックすると、Divコンポーネントの文字列が変わることを確認できます。

Dash㊳(Sliderコンポーネント)

Sliderコンポーネント

Sliderコンポーネントは単一のハンドルをもつスライダーです。

スライダーの設定値は次の通りです。

オプション 内容
min 最小値を設定
max 最大値を設定
step ステップを設定
value 初期値を設定
dots Trueを指定するとスライダーにドットを表示

スライダーを変更すると、その選択値をスライダーの下に表示するアプリケーションを作成します。

[ソースコード]

1
2
3
4
5
6
7
8
9
10
11
12
13
14
15
16
17
18
19
20
21
22
23
24
25
26
27
28
29
30
31
32
33
34
35
36
37
38
39
40
41
42
import dash
import dash_core_components as dcc
import dash_html_components as html
from dash.dependencies import Input, Output

app = dash.Dash(__name__) # Dashインスタンスを生成

app.layout = html.Div(
[
html.Br(),
dcc.Slider(
id='slider1',
min=-10, # 最小値
max=100, # 最大値
step=1, # 目盛り
value=50, # 初期値
marks={
-10:{'label':'-10度', 'style':{'color':'red', 'fontSize':10}},
0:{'label':'0', 'style':{'fontSize':10}},
25:{'label':'25度'},
50:{'label':'50度', 'style':{'color':'red', 'fontSize':15}},
75:{'label':'75度'},
100:{'label':'100度', 'style':{'color':'green', 'fontSize':12}},
},
#dots=True
),
html.Br(),
html.Div(id='div1')
],
style={'width':'80%', 'margin':'auto'}
)

# コールバック
@app.callback(
Output('div1', 'children'),
Input('slider1', 'value')
)
def change_img(checklist1):
return '選択しているのは"{}"です'.format(checklist1)

if __name__ == '__main__':
app.run_server(debug=True) # アプリケーションを起動

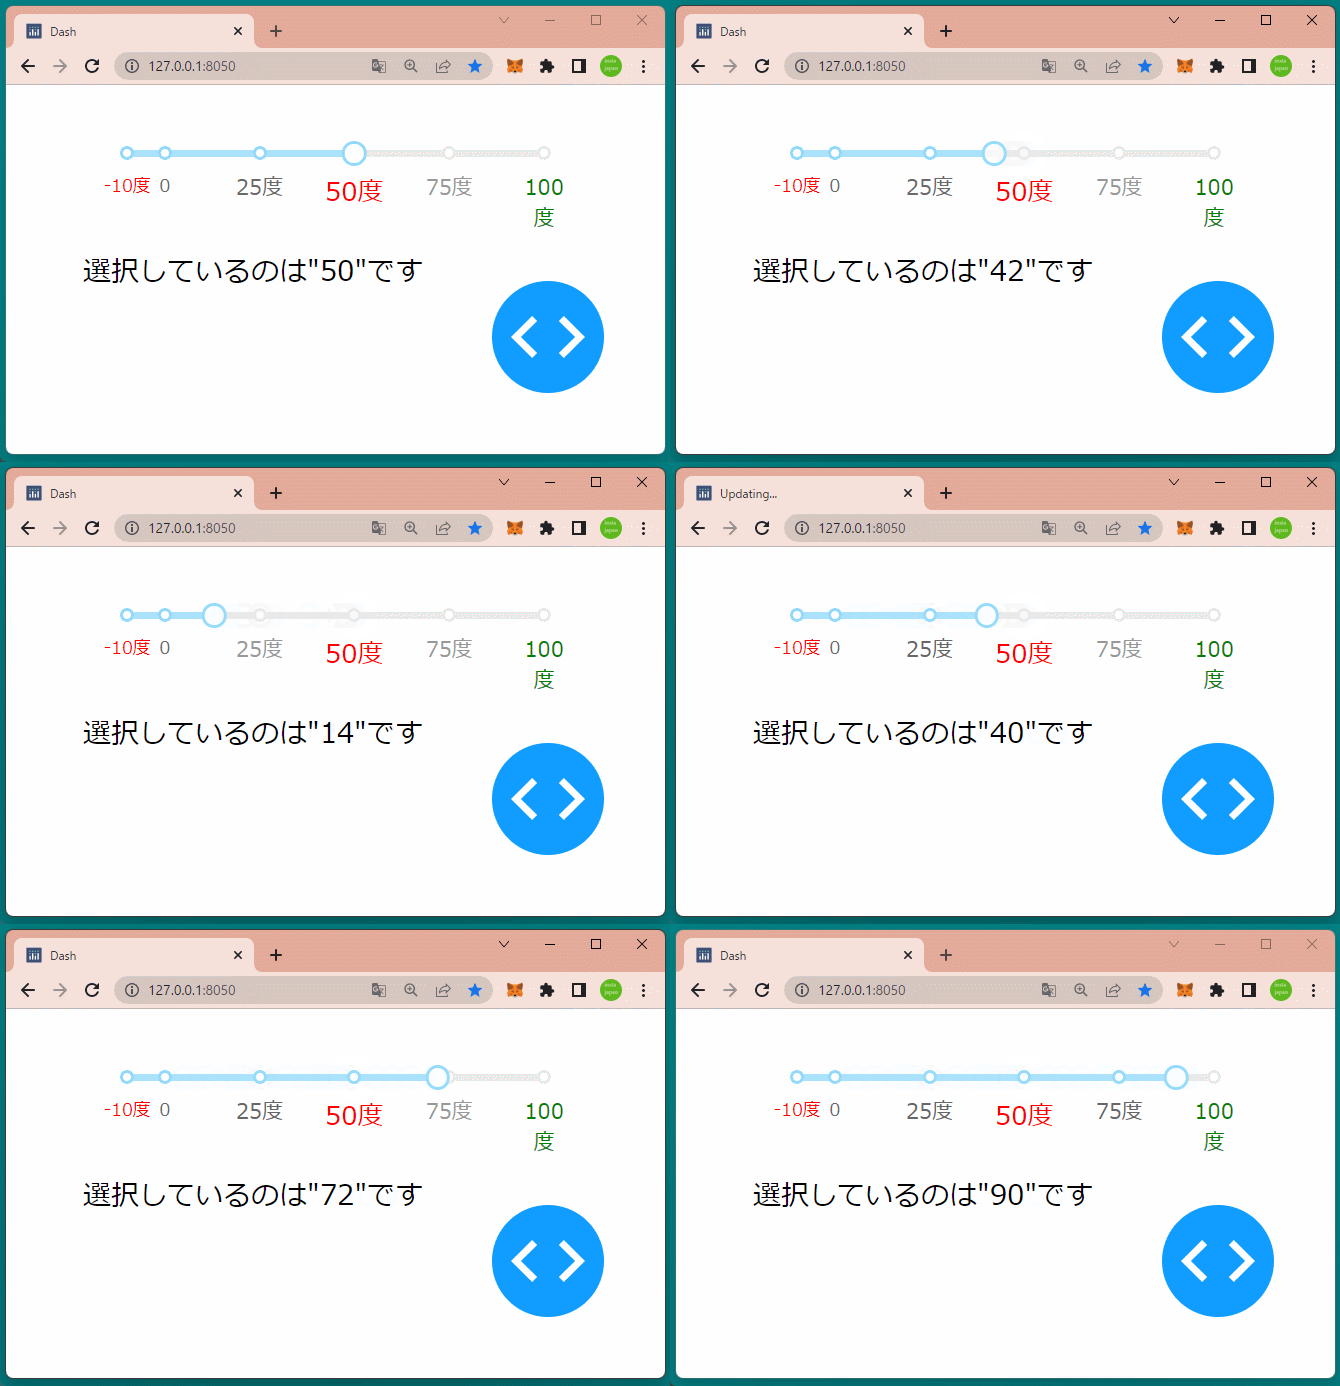
目盛りのスタイルは引数 marksに数値をキー、ラベルとスタイル設定した辞書型データを設定しています。(17~24行目)

コールバック関数では、スライダーで選択された値をDivコンポーネントに反映しています。(34~39行目)

[ブラウザで表示]

スライダーを移動すると、その選択値がスライダーの下に表示されることを確認できます。

Dash㊲(Loadingコンポーネント)

Loadingコンポーネント

Loadingコンポーネントを使用すると、children引数に格納したコンポーネントのロード中にローディング画面を表示することができます。

Loadingクラスの引数は下記の通りです。

オプション データ型 内容
color 文字列 ローディングの色を設定
fullscreen ブール型 ローディングを全画面表示
type 文字列 ローディングの種類を設定
“default”, “graph”, “cube”, “circle”, “dot”

今回は、リストからローディングの種類を選択し、ボタンを押すとLoading画面を5秒間表示します。

[ソースコード]

1
2
3
4
5
6
7
8
9
10
11
12
13
14
15
16
17
18
19
20
21
22
23
24
25
26
27
28
29
30
31
32
33
34
35
36
37
38
39
40
41
42
43
44
45
46
47
48
49
50
51
52
53
54
55
56
import time
import dash
import dash_core_components as dcc
import dash_html_components as html
from dash.dependencies import Input, Output, State

app = dash.Dash(__name__) # Dashインスタンスを生成

app.layout = html.Div(
[
html.H3('Loading Test'),

dcc.Dropdown(id='dropdown1',
options=[
{'label':'default', 'value':'default'},
{'label':'graph', 'value':'graph'},
{'label':'cube', 'value':'cube'},
{'label':'circle', 'value':'circle'},
{'label':'dot', 'value':'dot'}
]
),
html.Button(id='button1', children="Push"),
html.Br(),
html.Br(),
html.Br(),
html.Br(),
html.Br(),
html.Br(),
dcc.Loading(
id='loading1',
children=[html.H1(id='loading', style={'margin':100})]
)
],
style={'textAlign':'center'}
)

# コールバック1
@app.callback(
Output('loading1', 'type'),
Input('dropdown1', 'value')
)
def set_loading_type(dropdown1):
print('set_loading_type', dropdown1)
return dropdown1

# コールバック2
@app.callback(
Input('button1', 'n_clicks')
)
def start_loading(n_clicks):
print('start_loading', n_clicks)
time.sleep(5)
return

if __name__ == '__main__':
app.run_server(debug=True) # アプリケーションを起動

1つめのコールバックでは、リストから選択されたローディングの種類をLoadingコンポーネントに設定しています。

2つめのコールバックでは、Loadingコンポーネントを5秒間表示しています。(今回はOutputにはなにも設定していません。)

[ブラウザで表示]

リストから各ローディングの種類を選択しボタンを押すと、いろいろな種類のLoading画面が表示されることを確認できます。

Dash㊱(Checklistコンポーネント)

Checklistコンポーネント

前回はRadioItemコンポーネントの動作を確認しましたが、今回はChecklistコンポーネントの動作を確認していきます。

実装方法は、RadioItemコンポーネントとほとんど同じで、RadioItemクラスChecklistクラスに変更するだけです。(11行目)

初期値のvalueには、リスト型のデータのみ設定できます。(18行目)

[ソースコード]

1
2
3
4
5
6
7
8
9
10
11
12
13
14
15
16
17
18
19
20
21
22
23
24
25
26
27
28
29
30
31
32
33
34
35
import dash
import dash_core_components as dcc
import dash_html_components as html
from dash.dependencies import Input, Output

app = dash.Dash(__name__) # Dashインスタンスを生成

app.layout = html.Div(
[
html.Br(),
dcc.Checklist(id='checklist1',
options=[
{'label':'愛媛', 'value':'ehime'},
{'label':'香川', 'value':'kagawa'},
{'label':'徳島', 'value':'tokushima'},
{'label':'高知', 'value':'kouchi'}
],
value=['ehime', 'kouchi'], # 複数選択のみ
),
html.Br(),
html.Div(id='div1')
],
style={'width':'80%', 'margin':'auto'}
)

# コールバック
@app.callback(
Output('div1', 'children'),
Input('checklist1', 'value')
)
def change_img(checklist1):
return '選択しているのは"{}"です'.format(checklist1)

if __name__ == '__main__':
app.run_server(debug=True) # アプリケーションを起動

[ブラウザで表示]

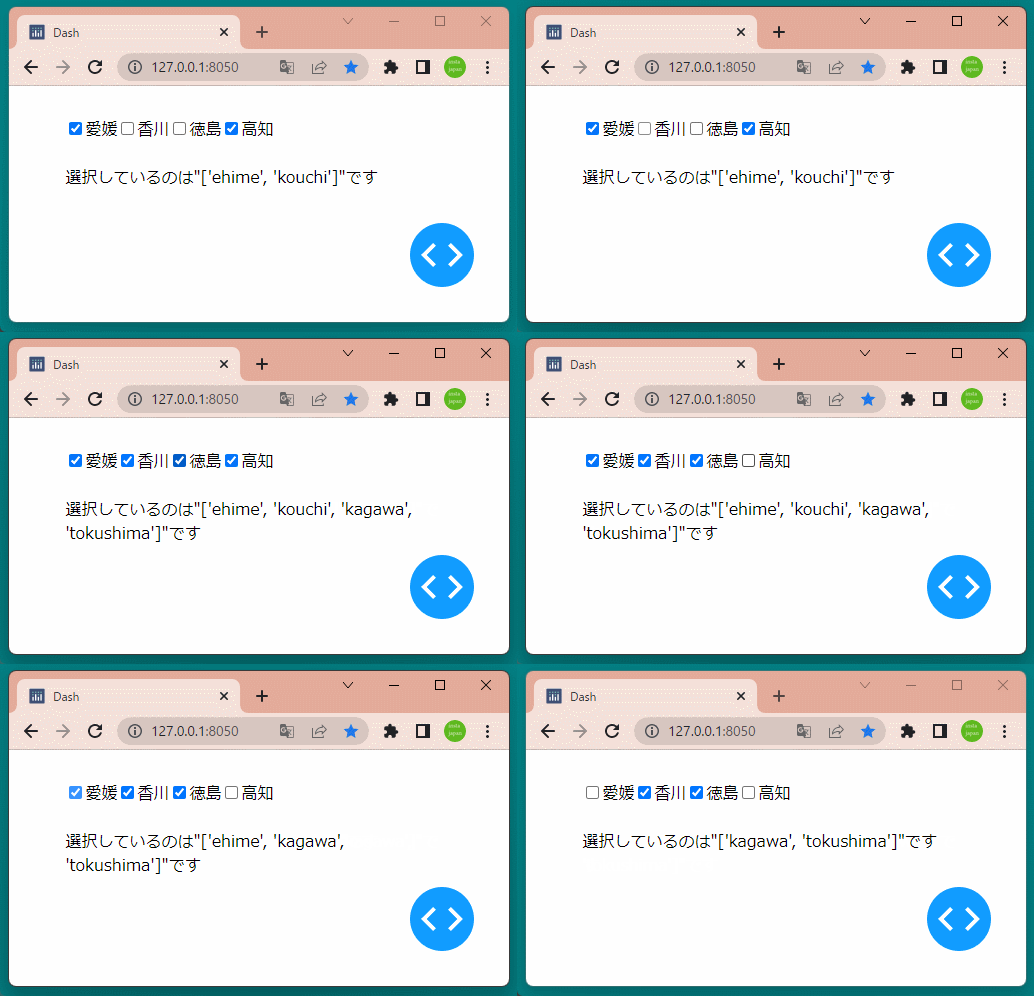
未選択の項目をクリックすると選択済み項目となり、選択済みの項目をクリックすると選択が解除されることが確認できます。