Weierstrass関数 3Dグラフ化
Weierstrass関数を使用して3Dグラフを描画するサンプルコードです。
Weierstrass関数は、連続だが全ての点で微分可能でない関数であり、複雑な振る舞いを示します。
1 | import matplotlib.pyplot as plt |
この例では、Weierstrass関数の形状を視覚化しています。
Weierstrass関数は、周期的でありながらも、微分可能ではないため、興味深い挙動を示します。
[実行結果]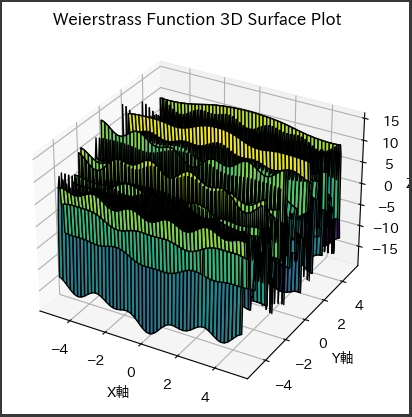
ソースコード解説
ソースコードの各部分の詳細な説明を示します。
1. Weierstrass関数の定義
1 | def weierstrass(x, y): |
この関数は、Weierstrass関数を計算するためのものです。
関数は2つの引数 x と y を取り、その位置でのWeierstrass関数の値を計算して返します。
Weierstrass関数は、無限級数で表現され、aおよびbといったパラメータによって挙動が制御されます。
この関数は100項までの無限級数を計算しています。
2. メッシュグリッドの生成
1 | x = np.linspace(-5, 5, 100) |
linspace関数を使用して、-5 から 5 の範囲を等間隔に区切った 100 個の点を生成し、meshgrid関数を使ってメッシュグリッドを作成しています。
これにより、2次元の座標平面ができます。
3. Weierstrass関数の計算
1 | z = weierstrass(x, y) |
メッシュグリッド上の各点 (x, y) における *:Weierstrass 関数**の値を計算し、z という配列に格納します。
4. 3Dグラフの描画
1 | fig = plt.figure() |
matplotlibライブラリを使用して3Dグラフを描画しています。plot_surface関数を使用して、メッシュグリッド上の (x, y, z) ポイントでの曲面をプロットします。
カラーマップは’viridis’、エッジカラーは黒に設定されています。
5. グラフの設定
1 | ax.set_xlabel('X軸') |
X軸、Y軸、Z軸のラベルおよびグラフのタイトルを設定しています。
6. グラフの表示
1 | plt.show() |
最後に、作成した3Dグラフを表示します。