
アルツハイマー病の診断
アルツハイマー病の診断には、様々な特徴量が関与しますが、ここではシンプルな例として、年齢と一部の生化学的指標(例えば、血液中の特定のタンパク質レベル)を特徴量として使用するとします。
以下に、scikit-learnを使用した分類問題の解き方を示します。
まず、必要なライブラリをインポートします。
1 | import numpy as np |
次に、仮想的なデータセットを作成します。
ここでは、年齢とタンパク質レベルの2つの特徴量を持つ1000人の患者データを生成します。
また、各患者がアルツハイマー病であるかどうかをランダムに決定します。
1 | np.random.seed(0) |
データを訓練セットとテストセットに分割します。
1 | X_train, X_test, y_train, y_test = train_test_split(X, y, test_size=0.2, random_state=0) |
ランダムフォレスト分類器を訓練します。
1 | clf = RandomForestClassifier(n_estimators=100, random_state=0) |
テストセットでの予測と評価を行います。
1 | y_pred = clf.predict(X_test) |
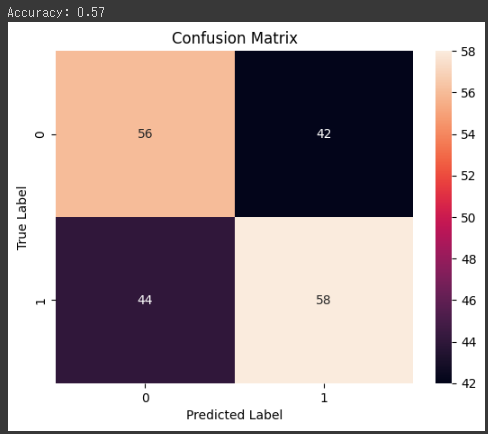
最後に、混同行列をグラフ化します。
1 | cm = confusion_matrix(y_test, y_pred) |
このコードは、ランダムに生成したデータに対してランダムフォレスト分類器を訓練し、テストデータでの予測精度を計算し、混同行列を表示します。
[実行結果]
実際の問題では、適切な特徴量の選択と前処理、モデルの選択とチューニングが重要となります。