1
2
3
4
5
6
7
8
9
10
11
12
13
14
15
16
17
18
19
20
21
22
23
24
25
26
27
28
29
30
31
32
33
34
35
36
37
38
39
40
41
42
43
44
45
46
47
48
49
50
51
52
53
54
55
56
57
58
59
60
61
| import numpy as np
import matplotlib.pyplot as plt
from sklearn.feature_extraction.text import CountVectorizer
from sklearn.model_selection import train_test_split
from sklearn.linear_model import LogisticRegression
from sklearn.metrics import accuracy_score, confusion_matrix
np.random.seed(42)
comments = [
"この映画は素晴らしいです!",
"最悪の映画でした...",
"絶対におすすめできません。",
"興奮しました!",
"つまらないストーリーでした。",
"感動的な結末でした。",
]
labels = [1, 0, 0, 1, 0, 1]
for _ in range(94):
comment = "サンプルコメント"
sentiment = np.random.randint(2)
comments.append(comment)
labels.append(sentiment)
vectorizer = CountVectorizer()
X = vectorizer.fit_transform(comments)
X_train, X_test, y_train, y_test = train_test_split(X, labels, test_size=0.2, random_state=42)
model = LogisticRegression()
model.fit(X_train, y_train)
y_pred = model.predict(X_test)
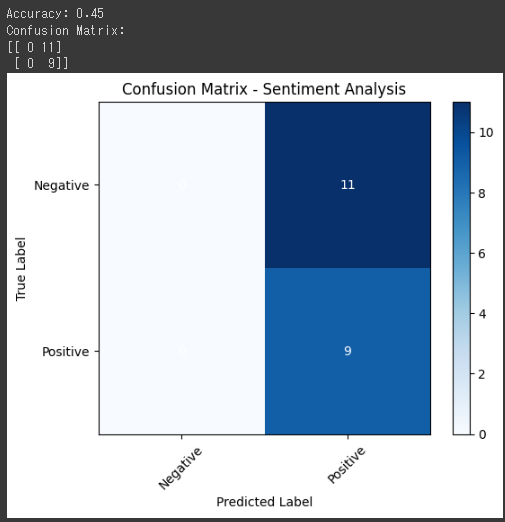
accuracy = accuracy_score(y_test, y_pred)
print("Accuracy:", accuracy)
cm = confusion_matrix(y_test, y_pred)
print("Confusion Matrix:")
print(cm)
labels = ['Negative', 'Positive']
plt.imshow(cm, interpolation='nearest', cmap=plt.cm.Blues)
plt.title("Confusion Matrix - Sentiment Analysis")
plt.colorbar()
tick_marks = np.arange(len(labels))
plt.xticks(tick_marks, labels, rotation=45)
plt.yticks(tick_marks, labels)
plt.xlabel('Predicted Label')
plt.ylabel('True Label')
for i in range(len(labels)):
for j in range(len(labels)):
plt.text(j, i, str(cm[i, j]), ha='center', va='center', color='white')
plt.show()
|