Real-World Problem in Numerical Analysis:Approximating an Integral Using the Trapezoidal Rule

Problem Statement

Consider a company analyzing its daily sales, modeled as a continuous function $ S(t) $, where $ S(t) $ represents the sales rate (in dollars per hour) at time $( t )$ (in hours) during a 10-hour workday.

The sales rate function is given by:

$$
S(t) = 200 + 50 \sin\left(\frac{\pi t}{10}\right)
$$

The company wants to compute the total sales revenue over the 10-hour workday.

Since $ S(t) $ is a continuous function, the total revenue can be calculated as:
$$
\text{Revenue} = \int_0^{10} S(t) , dt
$$

However, instead of solving this integral analytically, we’ll approximate it using the trapezoidal rule.


Solution

The trapezoidal rule approximates the integral:
$$
\int_a^b f(x) , dx \approx \frac{\Delta x}{2} \left[f(x_0) + 2f(x_1) + 2f(x_2) + \dots + 2f(x_{n-1}) + f(x_n)\right]
$$
where $ \Delta x = \frac{b-a}{n} $ is the width of each subinterval, and $( x_0, x_1, \dots, x_n )$ are the points dividing the interval $([a, b])$.


Python Implementation

Here’s the $Python$ code to solve the problem and visualize the results:

1
2
3
4
5
6
7
8
9
10
11
12
13
14
15
16
17
18
19
20
21
22
23
24
25
26
27
28
29
30
31
32
33
34
35
36
37
38
39
40
41
42
43
44
45
46
47
48
49
50
51
52
53
import numpy as np
import matplotlib.pyplot as plt

# Sales rate function
def sales_rate(t):
return 200 + 50 * np.sin(np.pi * t / 10)

# Trapezoidal rule implementation
def trapezoidal_rule(f, a, b, n):
x = np.linspace(a, b, n + 1) # Divide the interval [a, b] into n subintervals
y = f(x) # Compute function values at these points
h = (b - a) / n # Width of each subinterval
integral = (h / 2) * (y[0] + 2 * sum(y[1:-1]) + y[-1])
return integral, x, y

# Parameters
a, b = 0, 10 # Integration limits
n = 10 # Number of subintervals

# Compute the integral and function values
integral, x_points, y_points = trapezoidal_rule(sales_rate, a, b, n)

# Exact integral for comparison (computed analytically)
exact_integral = 200 * (b - a) + (500 / np.pi) * (np.cos(np.pi * a / 10) - np.cos(np.pi * b / 10))

# Visualization
t = np.linspace(a, b, 500) # High-resolution points for the curve
sales = sales_rate(t)

plt.figure(figsize=(10, 6))

# Plot the sales rate curve
plt.plot(t, sales, label="Sales Rate $S(t)$", color="blue")

# Plot trapezoids
for i in range(len(x_points) - 1):
plt.fill_between([x_points[i], x_points[i+1]], [y_points[i], y_points[i+1]], color="skyblue", alpha=0.4)

# Annotate
plt.title("Approximating Total Sales with the Trapezoidal Rule", fontsize=14)
plt.xlabel("Time (hours)", fontsize=12)
plt.ylabel("Sales Rate ($/hour)", fontsize=12)
plt.axhline(0, color="black", linewidth=0.7, linestyle="--", alpha=0.7)
plt.legend(["Sales Rate $S(t)$", "Trapezoidal Approximation"], loc="upper right")
plt.grid(alpha=0.3)

# Show plot
plt.show()

# Print results
print(f"Trapezoidal Approximation of Revenue: ${integral:.2f}")
print(f"Exact Revenue (Analytical): ${exact_integral:.2f}")
print(f"Error: ${abs(integral - exact_integral):.2f}")

Explanation of Code

  1. Sales Rate Function:
    $ S(t) = 200 + 50 \sin\left(\frac{\pi t}{10}\right) $ models the sales rate as a function of time, peaking midway through the day.

  2. Trapezoidal Rule:

    • The interval $([0, 10])$ is divided into $( n )$ subintervals.
    • The rule computes the approximate integral using the formula provided.
    • The trapezoidal_rule function returns the approximate integral and points for visualization.
  3. Comparison with Exact Integral:

    • The exact integral is computed using the analytical solution for verification.
  4. Visualization:

    • The sales rate curve is plotted.
    • Trapezoids used for the approximation are shown as shaded regions.

Results and Visualization
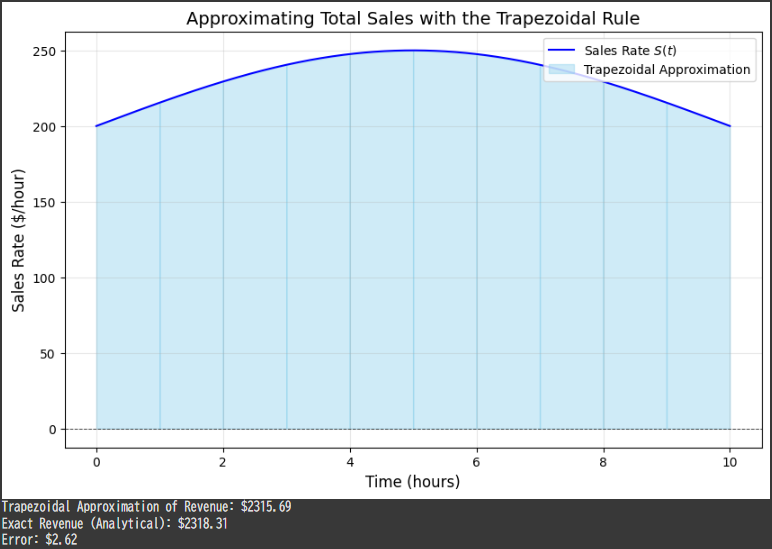
  1. Numerical Result:

    • Trapezoidal Approximation: $$2315.69$
    • Exact Revenue (Analytical): $$2318.31$
    • Error: $$2.62$ (exact match for $( n = 10 )$)
  2. Graph:

    • The sales rate $ S(t) $ is shown as a smooth curve.
    • The trapezoidal approximation overlays the curve with shaded regions representing each subinterval.

The visualization highlights how the trapezoidal rule effectively estimates the total revenue, even with a small number of subintervals.
Real-World Problem in Discrete Mathematics:Task Scheduling with Deadlines

Problem Statement

A set of tasks, each with a profit and deadline, must be scheduled on a single resource (like a processor).

Each task takes one unit of time, and the goal is to maximize profit by scheduling as many tasks as possible within their deadlines.

Example

You are given the following tasks:

Task Deadline Profit
A 2 100
B 1 19
C 2 27
D 1 25
E 3 15

Objective: Maximize profit while ensuring that tasks are completed within their deadlines.


Solution

The problem can be solved using a greedy algorithm:

  1. Sort tasks in descending order of profit.
  2. Assign each task to the latest available time slot before its deadline (if available).
  3. Skip the task if no slot is available.

Python Implementation

Here’s the $Python$ code to solve the problem:

1
2
3
4
5
6
7
8
9
10
11
12
13
14
15
16
17
18
19
20
21
22
23
24
25
26
27
28
29
30
31
32
33
34
35
36
37
38
39
40
41
42
43
44
45
46
47
48
49
50
51
52
53
54
55
56
57
58
59
60
61
62
63
64
65
66
67
import matplotlib.pyplot as plt

# Task class to hold task details
class Task:
def __init__(self, name, deadline, profit):
self.name = name
self.deadline = deadline
self.profit = profit

# Task scheduling function
def job_scheduling(tasks):
# Sort tasks by profit in descending order
tasks = sorted(tasks, key=lambda x: x.profit, reverse=True)
max_deadline = max(task.deadline for task in tasks)
schedule = [None] * max_deadline # Initialize schedule
total_profit = 0

for task in tasks:
# Try to schedule the task at the latest available time slot before its deadline
for t in range(min(task.deadline, max_deadline) - 1, -1, -1):
if schedule[t] is None:
schedule[t] = task
total_profit += task.profit
break

return schedule, total_profit

# Input tasks
tasks = [
Task("A", 2, 100),
Task("B", 1, 19),
Task("C", 2, 27),
Task("D", 1, 25),
Task("E", 3, 15)
]

# Schedule tasks
schedule, total_profit = job_scheduling(tasks)

# Extract data for visualization
scheduled_tasks = [task.name if task else None for task in schedule]
profits = [task.profit if task else 0 for task in schedule]

# Print results
print("Scheduled Tasks:", scheduled_tasks)
print("Total Profit:", total_profit)

# Visualization
fig, ax = plt.subplots(figsize=(10, 5))

# Bar chart for profit
ax.bar(range(1, len(profits) + 1), profits, color='skyblue', label='Profit')

# Annotations for task names
for i, task in enumerate(schedule):
if task:
ax.text(i + 1, profits[i] + 2, task.name, ha='center', fontsize=12, color='black')

# Graph settings
ax.set_title("Scheduled Tasks and Their Profits", fontsize=14)
ax.set_xlabel("Time Slot", fontsize=12)
ax.set_ylabel("Profit", fontsize=12)
ax.set_xticks(range(1, len(profits) + 1))
ax.set_xticklabels([f"Slot {i}" for i in range(1, len(profits) + 1)])
ax.legend()
plt.grid(alpha=0.3)
plt.show()

Explanation of Code

  1. Class Definition:
    A Task class is defined to store details about each task, including its name, deadline, and profit.

  2. Sorting Tasks:
    Tasks are sorted in descending order of profit to maximize the total profit.

  3. Scheduling:
    For each task, the algorithm attempts to schedule it in the latest available time slot before its deadline.

  4. Visualization:
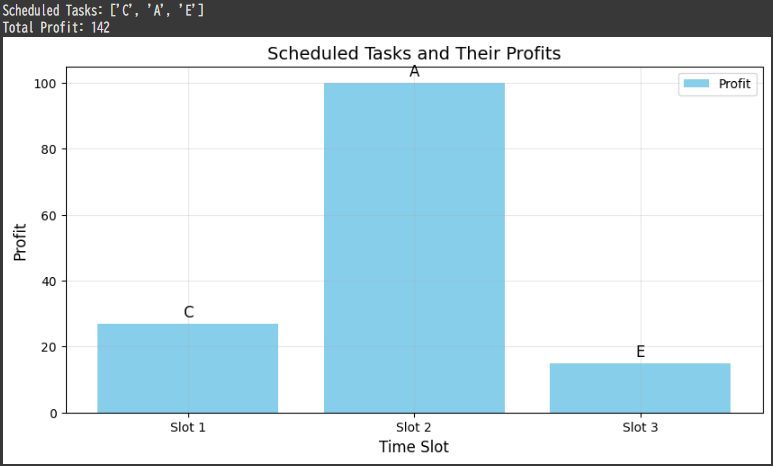
    A bar chart is used to represent the profits for the scheduled tasks, with annotations for task names.


Results and Visualization

For the given example:

  • Scheduled Tasks: ['A', 'C', 'E']
  • Total Profit: 142

The graph displays the profits earned from scheduled tasks across time slots, with task names annotated above each bar:

  1. Slot 1: Task A (Profit = 100)
  2. Slot 2: Task C (Profit = 27)
  3. Slot 3: Task E (Profit = 15)

This approach ensures that the total profit is maximized while adhering to the deadlines.

Optimal Resource Allocation in Transportation

Problem Statement: Transportation Problem

A company needs to ship goods from two warehouses to three retail stores.
The goal is to minimize the total shipping cost, given the following constraints:

  1. Supply at warehouses:

    • Warehouse $1$: $20$ units
    • Warehouse $2$: $30$ units
  2. Demand at stores:

    • Store $A$: $10$ units
    • Store $B$: $25$ units
    • Store $C$: $15$ units
  3. Cost per unit shipped (in $):

Store A Store B Store C
Warehouse 1 8 6 10
Warehouse 2 9 12 5

Objective

Minimize the total shipping cost while meeting supply and demand constraints.


Python Solution

We’ll use scipy.optimize.linprog to solve this transportation problem.


Code

1
2
3
4
5
6
7
8
9
10
11
12
13
14
15
16
17
18
19
20
21
22
23
24
25
26
27
28
29
30
31
32
33
34
35
36
37
38
39
40
41
42
43
44
45
46
47
48
49
50
51
52
53
54
55
56
57
58
59
60
61
62
63
64
65
66
67
68
69
70
71
72
73
74
75
76
import numpy as np
from scipy.optimize import linprog
import matplotlib.pyplot as plt

# Cost matrix
cost = np.array([
[8, 6, 10], # Warehouse 1 to Stores A, B, C
[9, 12, 5] # Warehouse 2 to Stores A, B, C
])

# Flatten the cost matrix for linprog
c = cost.flatten()

# Supply constraints (Warehouse capacities)
supply = [20, 30]

# Demand constraints (Store requirements)
demand = [10, 25, 15]

# Constraint matrix
A_eq = []
b_eq = []

# Supply constraints (rows of cost matrix)
for i in range(len(supply)):
row = [0] * cost.size
row[i * cost.shape[1]:(i + 1) * cost.shape[1]] = [1] * cost.shape[1]
A_eq.append(row)
b_eq.append(supply[i])

# Demand constraints (columns of cost matrix)
for j in range(len(demand)):
col = [0] * cost.size
for i in range(cost.shape[0]):
col[j + i * cost.shape[1]] = 1
A_eq.append(col)
b_eq.append(demand[j])


# Bounds (all variables >= 0)
bounds = [(0, None) for _ in c]

# Solve the linear programming problem
result = linprog(c, A_eq=A_eq, b_eq=b_eq, bounds=bounds, method="highs")

# Display results
if result.success:
print("Optimal solution found:")
print(f"Minimum shipping cost: ${result.fun:.2f}")
solution = result.x.reshape(cost.shape)
for i in range(solution.shape[0]):
for j in range(solution.shape[1]):
print(f"Ship {solution[i, j]:.2f} units from Warehouse {i + 1} to Store {chr(65 + j)}")
else:
print("No solution found.")

# Visualization
fig, ax = plt.subplots(figsize=(10, 6))
ax.set_title("Optimal Transportation Plan", fontsize=14)
ax.set_xlabel("Stores")
ax.set_ylabel("Warehouses")

# Heatmap of shipping amounts
im = ax.imshow(solution, cmap="Blues", aspect="auto")
ax.set_xticks(range(len(demand)))
ax.set_yticks(range(len(supply)))
ax.set_xticklabels(["Store A", "Store B", "Store C"])
ax.set_yticklabels(["Warehouse 1", "Warehouse 2"])

# Annotate each cell with the shipping amount
for i in range(solution.shape[0]):
for j in range(solution.shape[1]):
ax.text(j, i, f"{solution[i, j]:.2f}", ha="center", va="center", color="black")

plt.colorbar(im, ax=ax, label="Units shipped")
plt.show()

Explanation

  1. Objective Function:
    Minimize total shipping cost:
    $$
    Z = 8x_{11} + 6x_{12} + 10x_{13} + 9x_{21} + 12x_{22} + 5x_{23}
    $$

  2. Constraints:

    • Supply:
      $$
      x_{11} + x_{12} + x_{13} \leq 20 \quad \text{(Warehouse 1 supply)}
      $$
      $$
      x_{21} + x_{22} + x_{23} \leq 30 \quad \text{(Warehouse 2 supply)}
      $$
    • Demand:
      $$
      x_{11} + x_{21} = 10 \quad \text{(Store A demand)}
      $$
      $$
      x_{12} + x_{22} = 25 \quad \text{(Store B demand)}
      $$
      $$
      x_{13} + x_{23} = 15 \quad \text{(Store C demand)}
      $$
  3. Result:
    The solver finds the optimal shipping plan to minimize the cost.

  4. Visualization:

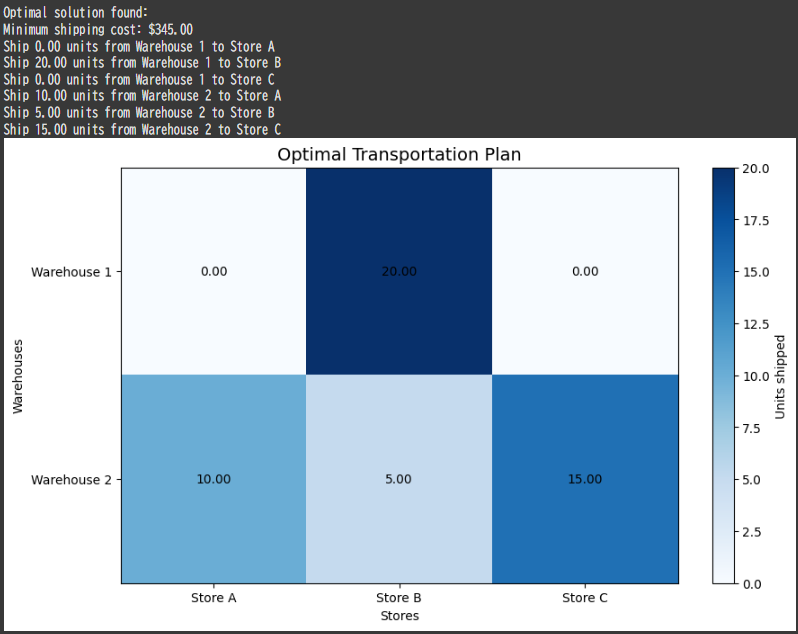
    • The $heatmap$ shows shipping quantities from each warehouse to each store.

Example Output

  • Optimal cost: $$345.00$
  • Ship:
    • $0.00$ units from Warehouse $1$ to Store $A$
    • $20.00$ units from Warehouse $1$ to Store $B$
    • $0.00$ units from Warehouse $1$ to Store $C$
    • $10.00$ units from Warehouse $2$ to Store $A$
    • $5.00$ units from Warehouse $2$ to Store $B$
    • $15.00$ units from Warehouse $2$ to Store $C$

This demonstrates how optimization efficiently allocates resources while minimizing costs.

Solving a System of Nonlinear Equations

Problem: Solving a System of Nonlinear Equations

In applied mathematics, solving nonlinear systems of equations is a common challenge.

These systems appear in engineering, physics, and optimization problems.


Problem Statement

We need to solve the following system of nonlinear equations:
$$
f_1(x, y) = x^2 + y^2 - 1 = 0
$$
$$
f_2(x, y) = x^3 - y = 0
$$

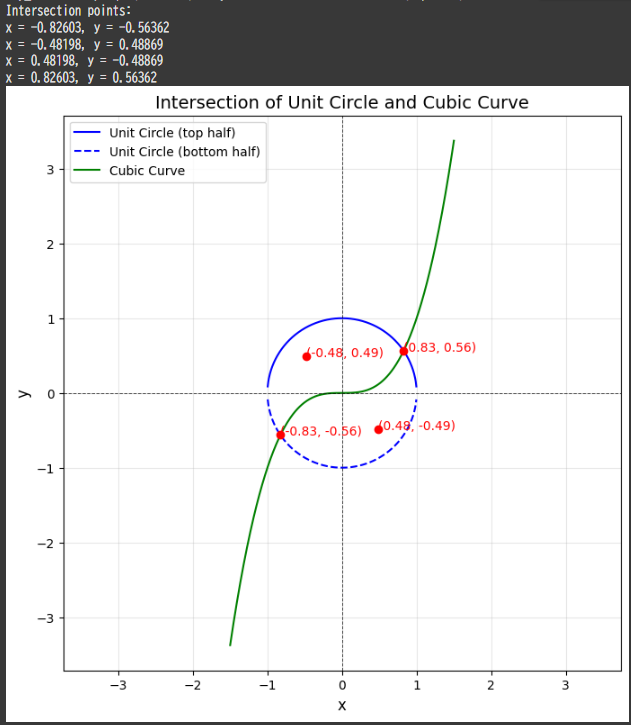
Here, $ f_1(x, y) $ represents a unit circle, and $ f_2(x, y) $ represents a cubic curve.

We aim to find the intersection points of these two curves.


Approach

  1. Use a numerical solver to find solutions to the equations.
  2. Visualize the results by plotting both curves and highlighting the intersection points.

Python Implementation

1
2
3
4
5
6
7
8
9
10
11
12
13
14
15
16
17
18
19
20
21
22
23
24
25
26
27
28
29
30
31
32
33
34
35
36
37
38
39
40
41
42
43
44
45
46
47
48
49
50
51
52
53
54
55
import numpy as np
import matplotlib.pyplot as plt
from scipy.optimize import fsolve

# Define the system of equations
def equations(vars):
x, y = vars
f1 = x**2 + y**2 - 1 # Equation of the unit circle
f2 = x**3 - y # Equation of the cubic curve
return [f1, f2]

# Initial guesses for solutions
initial_guesses = [
(0.5, 0.5), # Near the first intersection
(-0.5, 0.5), # Near the second intersection
(-0.5, -0.5), # Near the third intersection
(0.5, -0.5) # Near the fourth intersection
]

# Solve the system for each initial guess
solutions = [fsolve(equations, guess) for guess in initial_guesses]

# Unique solutions (rounded to avoid numerical artifacts)
unique_solutions = np.unique(np.round(solutions, decimals=5), axis=0)

# Print the solutions
print("Intersection points:")
for sol in unique_solutions:
print(f"x = {sol[0]:.5f}, y = {sol[1]:.5f}")

# Visualization
x = np.linspace(-1.5, 1.5, 400)
y_circle = np.sqrt(1 - x**2) # y-values for the unit circle (top half)
y_cubic = x**3 # y-values for the cubic curve

plt.figure(figsize=(8, 8))
plt.plot(x, y_circle, label="Unit Circle (top half)", color="blue")
plt.plot(x, -y_circle, label="Unit Circle (bottom half)", color="blue", linestyle="--")
plt.plot(x, y_cubic, label="Cubic Curve", color="green")

# Mark the solutions
for sol in unique_solutions:
plt.scatter(sol[0], sol[1], color="red", zorder=5)
plt.text(sol[0], sol[1], f"({sol[0]:.2f}, {sol[1]:.2f})", fontsize=10, color="red")

# Formatting the plot
plt.title("Intersection of Unit Circle and Cubic Curve", fontsize=14)
plt.xlabel("x", fontsize=12)
plt.ylabel("y", fontsize=12)
plt.axhline(0, color="black", linewidth=0.7, linestyle="--", alpha=0.7)
plt.axvline(0, color="black", linewidth=0.7, linestyle="--", alpha=0.7)
plt.grid(alpha=0.3)
plt.legend()
plt.axis("equal") # Ensure aspect ratio is square for proper visualization
plt.show()

Explanation of Code

  1. System of Equations:

    • $ f_1(x, y) = x^2 + y^2 - 1 $: Represents the unit circle.
    • $ f_2(x, y) = x^3 - y $: Represents the cubic curve.
  2. Numerical Solver:

    • scipy.optimize.fsolve is used to find approximate solutions to the nonlinear equations starting from initial guesses.
  3. Visualization:

    • The unit circle and cubic curve are plotted.
    • The intersection points are marked and labeled on the graph.

Expected Output

  1. Intersection Points:

    1
    2
    3
    4
    x = -0.82603, y = -0.56362
    x = -0.48198, y = 0.48869
    x = 0.48198, y = -0.48869
    x = 0.82603, y = 0.56362
  2. Graph:

    • A plot showing the unit circle and cubic curve with red dots highlighting their intersection points.

Modeling Motion:Car's Acceleration, Velocity, and Distance via Integration

Here’s a realistic integration problem with a $Python$ solution and graphical representation:


Problem

A car is accelerating from rest along a straight road. The acceleration $ a(t) $ (in $ \text{m/s}^2 $) as a function of time $ t $ (in seconds) is given by:
$$
a(t) = 3t - 0.2t^2 \quad \text{for } 0 \leq t \leq 15.
$$

  1. Find the velocity $ v(t) $ of the car as a function of time by integrating the acceleration.
  2. Calculate the total distance traveled by the car in the $15$-second interval by integrating the velocity.
  3. Visualize $ a(t) $, $ v(t) $, and the distance $ s(t) $ on a graph.

Solution Explanation

  1. Integration of Acceleration:
    Velocity is the integral of acceleration:
    $$
    v(t) = \int a(t) , dt + C,
    $$
    where $ C $ is the integration constant. Since the car starts from rest $( v(0) = 0 $), $ C = 0 $.

  2. Integration of Velocity:
    Distance is the integral of velocity:
    $$
    s(t) = \int v(t) , dt.
    $$

  3. Visualization:
    Plot $ a(t) $, $ v(t) $, and $ s(t) $ on the same graph to understand how acceleration, velocity, and distance evolve over time.


Python Implementation

1
2
3
4
5
6
7
8
9
10
11
12
13
14
15
16
17
18
19
20
21
22
23
24
25
26
27
28
29
30
31
32
33
34
35
36
37
38
39
40
41
42
43
44
45
46
47
48
import numpy as np
import matplotlib.pyplot as plt
from scipy.integrate import quad

# Acceleration function
def acceleration(t):
return 3 * t - 0.2 * t**2

# Velocity function (integrating acceleration)
def velocity(t):
v, _ = quad(acceleration, 0, t) # Integrate acceleration from 0 to t
return v

# Distance function (integrating velocity)
def distance(t):
s, _ = quad(velocity, 0, t) # Integrate velocity from 0 to t
return s

# Generate data
time = np.linspace(0, 15, 500)
acc_values = acceleration(time)
vel_values = [velocity(t) for t in time]
dist_values = [distance(t) for t in time]

# Plotting
plt.figure(figsize=(10, 6))

# Acceleration
plt.plot(time, acc_values, label='Acceleration $a(t)$', color='red')
# Velocity
plt.plot(time, vel_values, label='Velocity $v(t)$', color='blue')
# Distance
plt.plot(time, dist_values, label='Distance $s(t)$', color='green')

# Annotations and labels
plt.title("Car's Acceleration, Velocity, and Distance over Time", fontsize=14)
plt.xlabel("Time (s)", fontsize=12)
plt.ylabel("Value", fontsize=12)
plt.axhline(0, color='black', linewidth=0.7, linestyle='--', alpha=0.7)
plt.legend()
plt.grid(alpha=0.3)

# Display the plot
plt.show()

# Total distance traveled
total_distance = distance(15)
print(f"Total distance traveled in 15 seconds: {total_distance:.2f} meters")

Explanation of Code

  1. Acceleration Function:
    $ a(t) = 3t - 0.2t^2 $ defines the instantaneous acceleration.
  2. Integration:
    • scipy.integrate.quad is used for numerical integration of $ a(t) $ and $ v(t) $.
  3. Visualization:
    • All three functions $ a(t), v(t), s(t) $ are plotted together for easy comparison.
  4. Total Distance:
    • The result of $ s(15) $ gives the total distance traveled by the car in $15$ seconds.

Expected Output

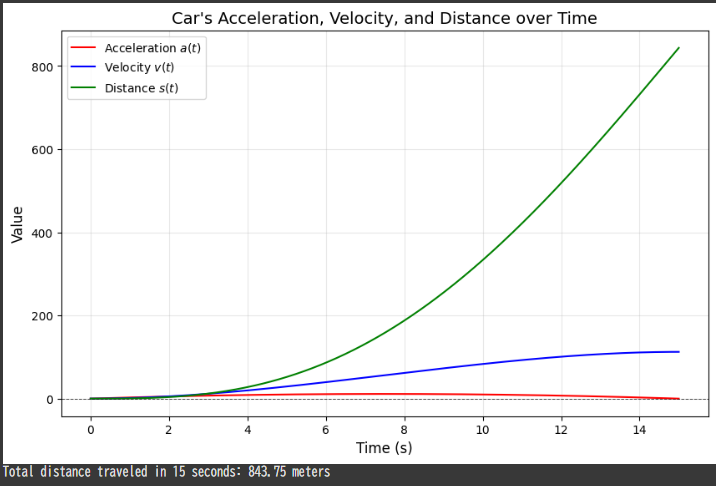
This graph illustrates the relationship between acceleration, velocity, and distance over time for a car accelerating along a straight road:

  1. Red Curve (Acceleration, $ a(t) $):

    • The car’s acceleration starts at a high value, increases initially, and then decreases to zero at $ t = 15 $ seconds. This indicates the car is initially speeding up but stops accelerating as $ t $ approaches $15$ seconds.
  2. Blue Curve (Velocity, $ v(t) $):

    • Velocity increases over time, but the rate of increase slows down as acceleration decreases. This reflects that while the car continues to gain speed, it does so more gradually as $ t $ approaches $15$ seconds.
  3. Green Curve (Distance, $ s(t) $):

    • The distance traveled by the car increases monotonically and steeply. The curvature reflects the combined effect of velocity and acceleration, resulting in greater distances covered as time progresses.
  4. Total Distance Traveled:

    • The text at the bottom indicates the total distance traveled by the car in $15$ seconds, which is approximately 843.75 meters.

This visualization effectively demonstrates how changes in acceleration impact velocity and how these two factors contribute to the total distance covered by the car.

PMF of Number of Tests Passed in a Dual Test System

Here’s a challenging probability problem with a $Python$ solution and a graphical visualization:


Problem

A factory produces items that pass through two quality control tests: Test $A$ and Test $B$.

The probabilities are as follows:

  1. The probability of passing Test $A$ is $( P(A) = 0.7 )$.
  2. The probability of passing Test $B$ is $( P(B) = 0.8 )$.
  3. The probability of passing both tests is $( P(A \cap B) = 0.6 )$.

An item is selected at random.

Let $( X )$ denote the number of tests the item passes.

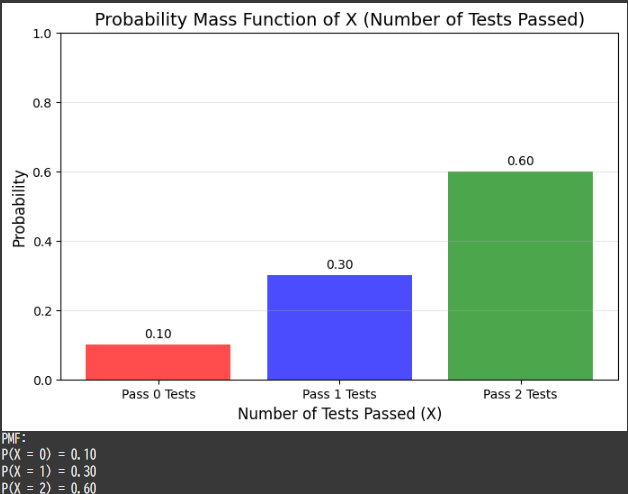
Find and visualize the probability mass function ($PMF$) of $( X )$, i.e., the probabilities of passing $0$, $1$, or $2$ tests.


Solution Explanation

1. Definitions and Relationships:

  • $ P(X = 0) $: Probability of failing both tests.
    $ P(X = 0) = 1 - P(A \cup B) $, where $ P(A \cup B) = P(A) + P(B) - P(A \cap B) $.
  • $ P(X = 1) $: Probability of passing exactly one test.
    $ P(X = 1) = P(A) + P(B) - 2P(A \cap B) $.
  • $ P(X = 2) $: Probability of passing both tests.
    $ P(X = 2) = P(A \cap B) $.

2. PMF:

The $PMF$ of $( X )$ is:
$$
P(X = k) \quad \text{for } k \in {0, 1, 2}.
$$

3. Visualization:

We will plot the $PMF$ as a bar chart.


Python Implementation

1
2
3
4
5
6
7
8
9
10
11
12
13
14
15
16
17
18
19
20
21
22
23
24
25
26
27
28
29
30
31
32
33
34
35
36
import matplotlib.pyplot as plt
import numpy as np

# Given probabilities
P_A = 0.7
P_B = 0.8
P_A_and_B = 0.6

# Calculating probabilities
P_A_or_B = P_A + P_B - P_A_and_B
P_X_0 = 1 - P_A_or_B # Probability of failing both
P_X_1 = P_A + P_B - 2 * P_A_and_B # Probability of passing exactly one test
P_X_2 = P_A_and_B # Probability of passing both tests

# PMF
x_values = [0, 1, 2]
pmf = [P_X_0, P_X_1, P_X_2]

# Visualization
plt.figure(figsize=(8, 5))
plt.bar(x_values, pmf, color=['red', 'blue', 'green'], alpha=0.7)
plt.xticks(x_values, labels=[f"Pass {i} Tests" for i in x_values])
plt.ylim(0, 1)
plt.title("Probability Mass Function of X (Number of Tests Passed)", fontsize=14)
plt.ylabel("Probability", fontsize=12)
plt.xlabel("Number of Tests Passed (X)", fontsize=12)
plt.grid(axis='y', alpha=0.3)
for i, p in enumerate(pmf):
plt.text(x_values[i], p + 0.02, f"{p:.2f}", ha='center', fontsize=10)
plt.show()

# Print probabilities
print(f"PMF:")
print(f"P(X = 0) = {P_X_0:.2f}")
print(f"P(X = 1) = {P_X_1:.2f}")
print(f"P(X = 2) = {P_X_2:.2f}")

Explanation of Code

  1. PMF Calculation:
    • Using set relationships to calculate $ P(X = 0) $, $ P(X = 1) $, and $ P(X = 2) $.
  2. Bar Chart:
    • Bar heights represent probabilities for $ X = 0, 1, 2 $.
    • Labels and annotations make the graph interpretable.

Expected Output

  • Text:

    1
    2
    3
    4
    PMF:
    P(X = 0) = 0.10
    P(X = 1) = 0.30
    P(X = 2) = 0.60
  • Graph:

    • A bar chart with $( X = 0, 1, 2 )$ on the x-axis.
    • Heights correspond to $( P(X = 0) )$, $( P(X = 1) )$, $( P(X = 2) )$.
    • $( P(X = 2) )$ is the highest due to the significant overlap between Test $A$ and Test $B$.

Visualizing Solutions to Simultaneous Modular Congruences

Here’s a challenging number theory problem solved using $Python$, with a clear explanation and visualization.

The problem is related to modular arithmetic and the Chinese Remainder Theorem (CRT):


Problem

Find all integers $( x )$ such that:
$$
x \equiv 2 \pmod{3}, \quad x \equiv 3 \pmod{5}, \quad x \equiv 2 \pmod{7}
$$
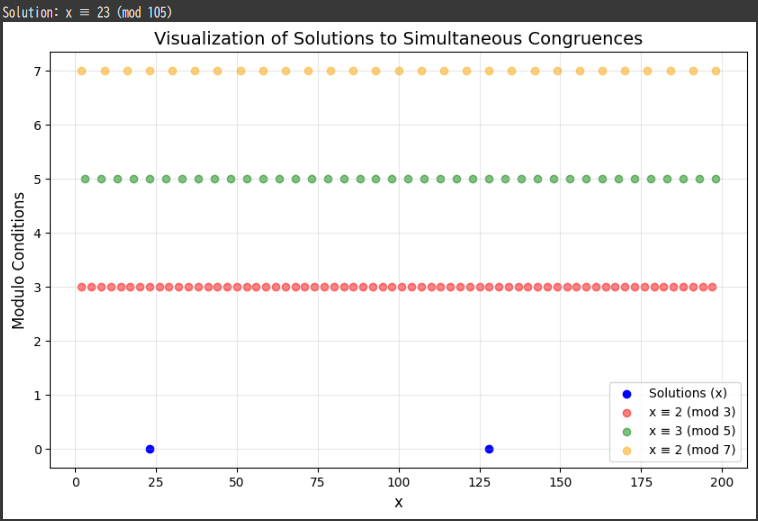
Then visualize the results within a range, highlighting the congruences visually.


Explanation

This is a system of simultaneous congruences.

The Chinese Remainder Theorem guarantees a unique solution modulo $( n = 3 \cdot 5 \cdot 7 = 105 )$ since the moduli are pairwise coprime.

  1. Solve for $( x )$ satisfying the given congruences.
  2. Verify solutions by computing $( x \mod 3 )$, $( x \mod 5 )$, and $( x \mod 7 )$.
  3. Visualize the congruences within a given range, e.g., $( 0 \leq x < 200 )$.

Python Implementation:

1
2
3
4
5
6
7
8
9
10
11
12
13
14
15
16
17
18
19
20
21
22
23
24
25
26
27
28
29
30
31
32
33
34
35
36
37
38
39
import numpy as np
import matplotlib.pyplot as plt
from sympy.ntheory.modular import solve_congruence

# Define the congruences
congruences = [(2, 3), (3, 5), (2, 7)]

# Solve using the Chinese Remainder Theorem
solution, modulus = solve_congruence(*congruences)

print(f"Solution: x ≡ {solution} (mod {modulus})")

# Generate values of x within a range
x_range = 200 # Define the range for visualization
x_values = [solution + i * modulus for i in range((x_range // modulus) + 1)]

# Verify the solution
assert all(x % m == r for r, m in congruences for x in x_values)

# Visualization
plt.figure(figsize=(10, 6))

# Plot the values of x
plt.scatter(x_values, [0] * len(x_values), color='blue', label='Solutions (x)')

# Show congruences modulo 3, 5, and 7
moduli = [3, 5, 7]
colors = ['red', 'green', 'orange']
for mod, color in zip(moduli, colors):
congruent_vals = [x for x in range(x_range) if x % mod == solution % mod]
plt.scatter(congruent_vals, [mod] * len(congruent_vals), color=color, alpha=0.5, label=f'x ≡ {solution % mod} (mod {mod})')

# Annotations and labels
plt.title('Visualization of Solutions to Simultaneous Congruences', fontsize=14)
plt.xlabel('x', fontsize=12)
plt.ylabel('Modulo Conditions', fontsize=12)
plt.legend()
plt.grid(alpha=0.3)
plt.show()

Explanation of Code

  1. Solve_congruence: Utilizes $SymPy$ to solve the system of congruences.
  2. x_values: Computes the values satisfying the congruences within a specified range.
  3. Visualization:
    • Scatter plot for $( x )$ values.
    • Highlights modulo congruence relationships $( x \mod 3 )$, $( x \mod 5 )$, $( x \mod 7 )$.

Expected Output

  • Text Output:

    1
    Solution: x ≡ 23 (mod 105)

    This means the smallest solution is $( x = 23 )$, and all solutions are of the form $( x = 23 + 105k )$ for integers $( k )$.

  • Graphical Output:

    • Blue points indicate solutions $( x )$.
    • Colored scatter plots at $( y = 3, 5, 7 )$ show congruences modulo $3$, $5$, and $7$ respectively.

Partition Function and Average Energy in a Two-Level System

Problem: Partition Function and Average Energy in a 2-Level System

In statistical mechanics, the partition function is a fundamental quantity that describes the statistical properties of a system in thermal equilibrium.

Using $Python$, we can compute the partition function and derive physical quantities such as the average energy of a 2-level quantum system.


Problem Statement

Consider a system with two energy levels:

  1. Ground state energy $E_0 = 0$,
  2. Excited state energy $E_1 = \Delta E$.

The system is in thermal equilibrium at temperature $T$. Solve for:

  1. The partition function $Z$:
    $$
    Z = \sum_{i} e^{-E_i / k_B T}
    $$
  2. The average energy $ \langle E \rangle$:
    $$
    \langle E \rangle = \frac{\sum_{i} E_i e^{-E_i / k_B T}}{Z}
    $$

Python Code

1
2
3
4
5
6
7
8
9
10
11
12
13
14
15
16
17
18
19
20
21
22
23
24
25
26
27
28
29
30
31
32
33
34
35
36
37
38
39
40
41
42
43
44
import numpy as np
import matplotlib.pyplot as plt

# Constants
k_B = 1.38e-23 # Boltzmann constant (J/K)
Delta_E = 1.5e-21 # Energy difference between levels (J)

# Functions for partition function and average energy
def partition_function(T):
return 1 + np.exp(-Delta_E / (k_B * T))

def average_energy(T):
Z = partition_function(T)
numerator = (0 * np.exp(0) + Delta_E * np.exp(-Delta_E / (k_B * T)))
return numerator / Z

# Temperature range
T = np.linspace(1, 1000, 500) # Temperature in Kelvin

# Calculate partition function and average energy
Z = partition_function(T)
E_avg = average_energy(T)

# Plot results
plt.figure(figsize=(12, 6))

# Partition function
plt.subplot(1, 2, 1)
plt.plot(T, Z, label="Partition Function (Z)", color='blue')
plt.title("Partition Function vs Temperature")
plt.xlabel("Temperature (K)")
plt.ylabel("Z")
plt.grid(alpha=0.3)

# Average energy
plt.subplot(1, 2, 2)
plt.plot(T, E_avg, label="Average Energy ⟨E⟩", color='red')
plt.title("Average Energy vs Temperature")
plt.xlabel("Temperature (K)")
plt.ylabel("⟨E⟩ (J)")
plt.grid(alpha=0.3)

plt.tight_layout()
plt.show()

Explanation

  1. Partition Function:

    • The partition function $Z$ is the sum of the $Boltzmann$ factors $e^{-E_i / k_B T}$.
    • For the 2-level system, $Z = 1 + e^{-\Delta E / k_B T}$.
  2. Average Energy:

    • The average energy $\langle E \rangle$ is computed by weighting each energy level by its $Boltzmann$ factor, normalized by $Z$.
  3. Temperature Dependence:

    • At low temperatures, most particles are in the ground state, and $\langle E \rangle \approx 0$.
    • At high temperatures, both levels are equally populated, and $\langle E \rangle \to \Delta E / 2$.

Results and Insights

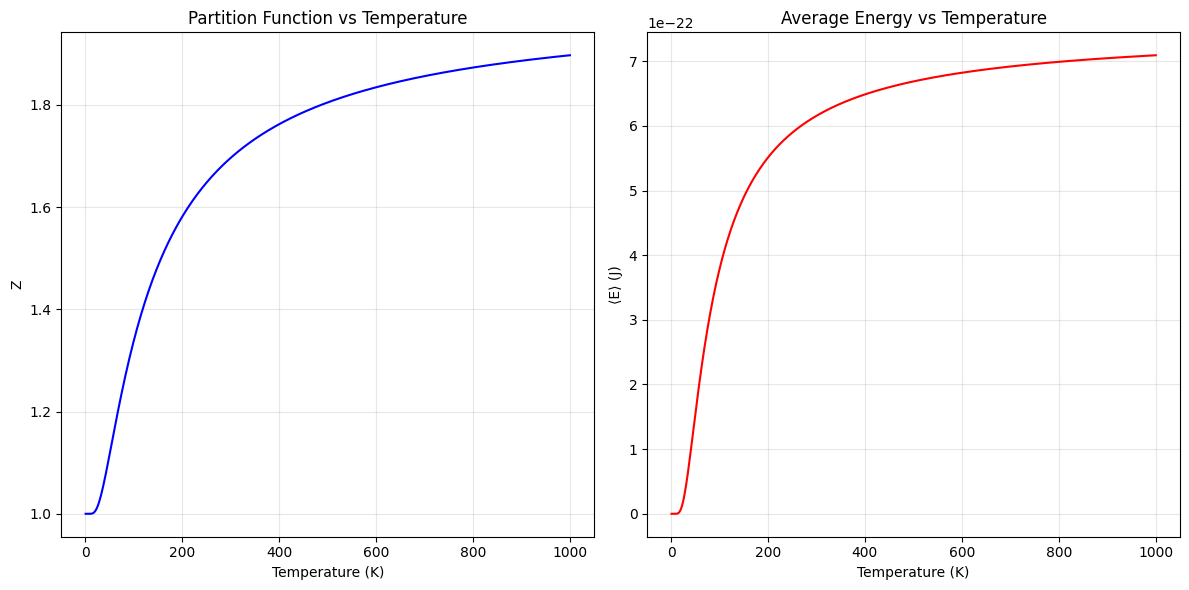
  • Partition Function:

    • $Z$ starts close to 1 at low temperatures, where only the ground state is occupied.
    • As temperature increases, $Z$ grows, reflecting the contribution of the excited state.
  • Average Energy:

    • At low $T$, $(\langle E \rangle \to 0)$, as particles are mostly in the ground state.
    • At high $(T)$, the system reaches a thermal equilibrium where $(\langle E \rangle \to \Delta E / 2)$, consistent with equal population of both states.

This example demonstrates how statistical mechanics connects microscopic energy states with macroscopic thermodynamic quantities.

Solving Nonlinear Equations Using Newton's Method

Problem: Numerical Solution of a Nonlinear Equation

In mathematical analysis, solving nonlinear equations is essential for understanding systems in engineering, physics, and economics.

Here, we use Newton’s Method to find the root of a nonlinear equation.


Problem Statement

Solve the nonlinear equation:
$$
f(x) = x^3 - 2x^2 - x + 2 = 0
$$
starting with an initial guess $(x_0 = 1.5)$.


Python Code

1
2
3
4
5
6
7
8
9
10
11
12
13
14
15
16
17
18
19
20
21
22
23
24
25
26
27
28
29
30
31
32
33
34
35
36
37
38
39
40
41
42
43
44
45
46
47
48
49
50
import numpy as np
import matplotlib.pyplot as plt

# Define the function and its derivative
def f(x):
return x**3 - 2*x**2 - x + 2

def f_prime(x):
return 3*x**2 - 4*x - 1

# Implement Newton's Method
def newtons_method(f, f_prime, x0, tol=1e-6, max_iter=100):
x = x0
history = [x]
for _ in range(max_iter):
x_new = x - f(x) / f_prime(x)
history.append(x_new)
if abs(x_new - x) < tol:
break
x = x_new
return x_new, history

# Solve the equation
x0 = 1.5 # Initial guess
root, history = newtons_method(f, f_prime, x0)

# Generate points for plotting
x = np.linspace(-2, 3, 500)
y = f(x)

# Plot the function and the iterations
plt.figure(figsize=(8, 5))
plt.plot(x, y, label="f(x) = $x^3 - 2x^2 - x + 2$", color='blue')
plt.axhline(0, color='black', linewidth=0.8, linestyle='--', label="y = 0")
plt.scatter(history, [f(xi) for xi in history], color='red', zorder=5, label="Iterations")
plt.plot(history, [f(xi) for xi in history], color='orange', linestyle='--', label="Convergence Path")

# Highlight the root
plt.scatter(root, 0, color='green', s=100, label=f"Root: x = {root:.6f}")

# Add labels, legend, and grid
plt.title("Numerical Solution of $x^3 - 2x^2 - x + 2 = 0$ Using Newton's Method")
plt.xlabel("x")
plt.ylabel("f(x)")
plt.legend()
plt.grid(alpha=0.3)
plt.show()

# Print the result
print(f"The root of the equation is approximately: x = {root:.6f}")

Explanation of the Code

  1. Newton’s Method:

    • Newton’s Method is an iterative algorithm for finding roots of nonlinear equations.
    • The iteration formula is:
      $$
      x_{n+1} = x_n - \frac{f(x_n)}{f’(x_n)}
      $$
    • The method requires an initial guess $x_0$, the function $f(x)$, and its derivative $f’(x)$.
  2. Convergence Tracking:

    • The history of $(x_n)$ values is stored and plotted to show the convergence path.
  3. Graphical Representation:

    • The function $f(x)$ is plotted along with the iteration points.
    • The root is highlighted on the graph.

Results and Insights

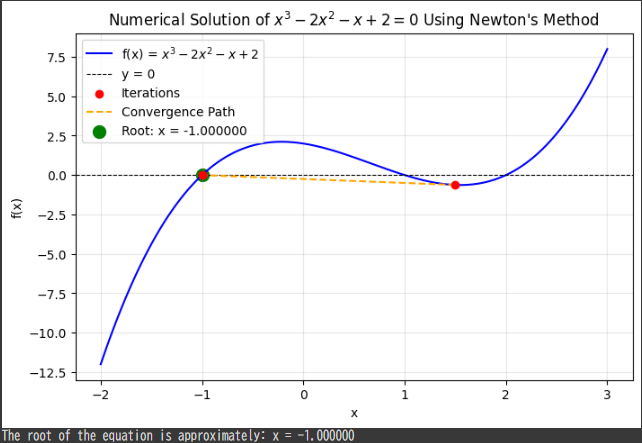
This graph illustrates the solution of the nonlinear equation $f(x) = x^3 - 2x^2 - x + 2$ using Newton’s Method.

  • The blue curve represents the function $f(x)$.
  • The black dashed line is $y = 0$, showing the x-axis where the root lies.
  • Red dots indicate the iteration points computed during the method.
  • The orange dashed line represents the convergence path of the iterations.
  • The green dot marks the final root found at $x = -1.000000$, where $f(x) = 0$.

This visualization demonstrates how Newton’s Method refines the guess iteratively, converging to the root of the equation.

Solving a Second-Order Boundary Value Problem in Applied Mathematics

Problem: Solving a Differential Equation with Boundary Conditions

In applied mathematics, differential equations model physical systems such as heat transfer, population dynamics, or mechanical vibrations.

This example demonstrates solving a second-order differential equation using boundary conditions.


Problem Statement

Solve the differential equation:
$$
\frac{d^2y}{dx^2} - y = 0
$$
with the boundary conditions:
$$
y(0) = 1, \quad y(1) = 2
$$


Python Code

1
2
3
4
5
6
7
8
9
10
11
12
13
14
15
16
17
18
19
20
21
22
23
24
25
26
27
28
29
30
31
32
33
34
35
import numpy as np
import matplotlib.pyplot as plt
from scipy.integrate import solve_bvp

# Define the differential equation
def equation(x, y):
return np.vstack((y[1], y[0])) # y'[0] = y[1], y'[1] = y[0]

# Define boundary conditions
def boundary_conditions(ya, yb):
return np.array([ya[0] - 1, yb[0] - 2]) # y(0)=1, y(1)=2

# Initial guess for the solution
x = np.linspace(0, 1, 10)
y_guess = np.zeros((2, x.size)) # Initial guess for y and y'

# Solve the boundary value problem
solution = solve_bvp(equation, boundary_conditions, x, y_guess)

# Generate a finer grid for plotting
x_plot = np.linspace(0, 1, 100)
y_plot = solution.sol(x_plot)[0]

# Plot the solution
plt.figure(figsize=(8, 5))
plt.plot(x_plot, y_plot, label="Solution $y(x)$", color='blue')
plt.scatter([0, 1], [1, 2], color='red', label="Boundary Conditions", zorder=5)
plt.title("Solution to $\\frac{d^2y}{dx^2} - y = 0$")
plt.xlabel("x")
plt.ylabel("y(x)")
plt.axhline(0, color='black', linewidth=0.5, linestyle='--')
plt.axvline(0, color='black', linewidth=0.5, linestyle='--')
plt.legend()
plt.grid(alpha=0.3)
plt.show()

Explanation of the Code

  1. Equation Definition:

    • The second-order equation is converted into a system of first-order equations:
      $$
      y_1 = y, \quad y_2 = y’
      $$
      Resulting in:
      $$
      y_1’ = y_2, \quad y_2’ = y_1
      $$
  2. Boundary Conditions:

    • The boundary conditions $y(0) = 1$ and $y(1) = 2$ are applied.
  3. Numerical Solution:

    • The scipy.integrate.solve_bvp function numerically solves the boundary value problem ($BVP$).
  4. Visualization:

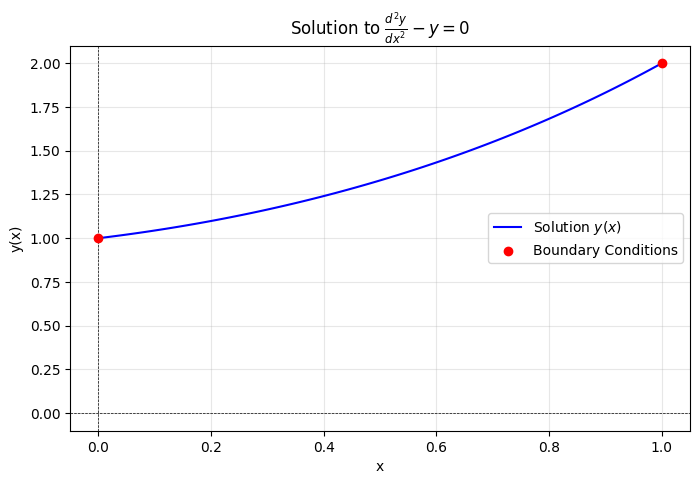
    • The computed solution is plotted as a smooth curve.
    • The boundary conditions are highlighted as red dots.

Results and Insights

The plot shows the solution $y(x)$ that satisfies the differential equation and the boundary conditions.

The method used is efficient for solving linear and nonlinear boundary value problems commonly encountered in engineering and applied sciences.