ビットコインの 1日足 のデータでの投資シミュレーション6回目です。
強化学習のパラメータ
ソースはこれまでの応用なので割愛し、強化学習のパラメータだけを下記に示します。
学習アルゴリズム(前回と同様)
PPO2参照する直前データ数(前回と同様)
50学習データ
[2017-07-13 ~ 2018-05-11] 1日足データ(前回と同様)検証データ
[2019-09-23 ~ 2020-07-19] 1日足データ(500日分移動)
投資結果
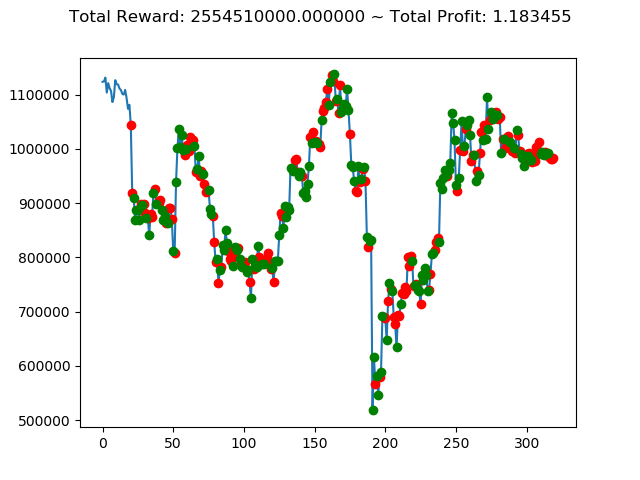
実行結果は以下の通りです。
[コンソール出力]
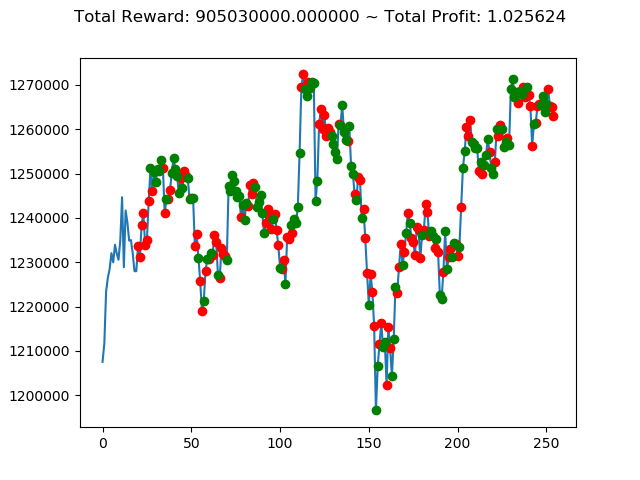
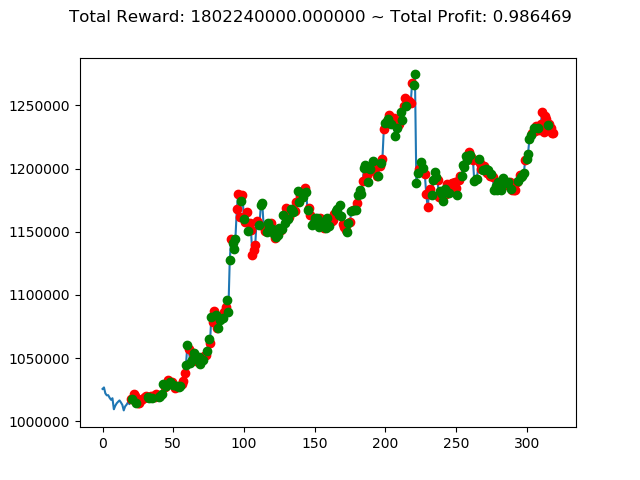
1 | info: {'total_reward': 2554510000.0, 'total_profit': 1.1834550378134772, 'position': 0} |
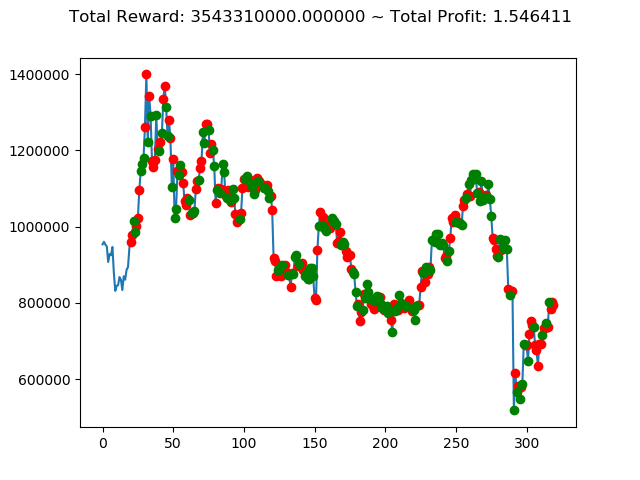
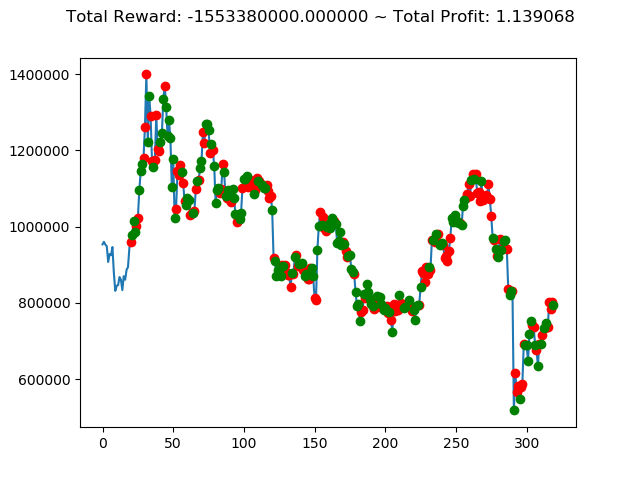
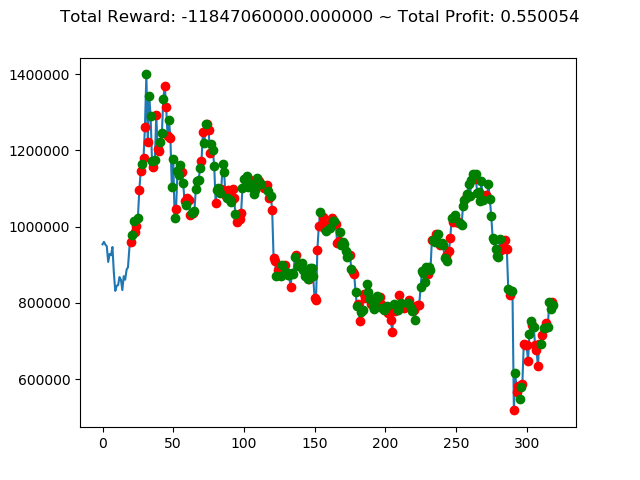
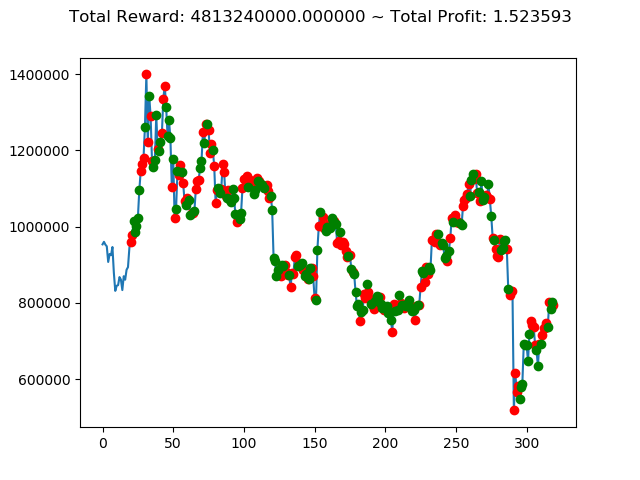
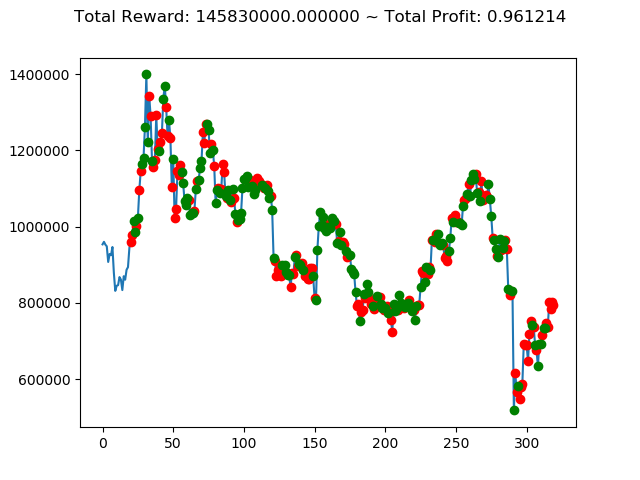
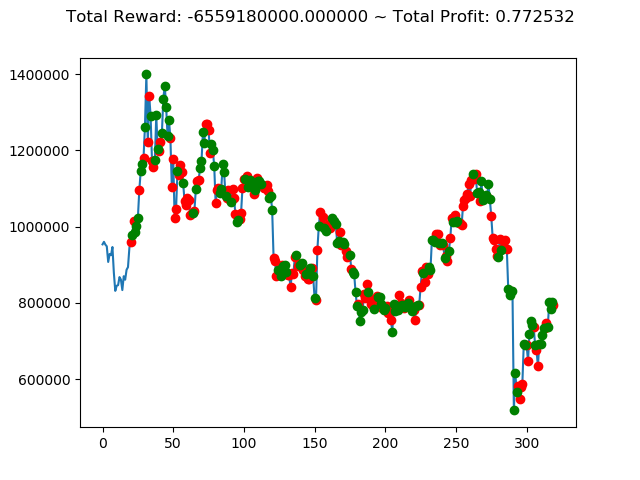
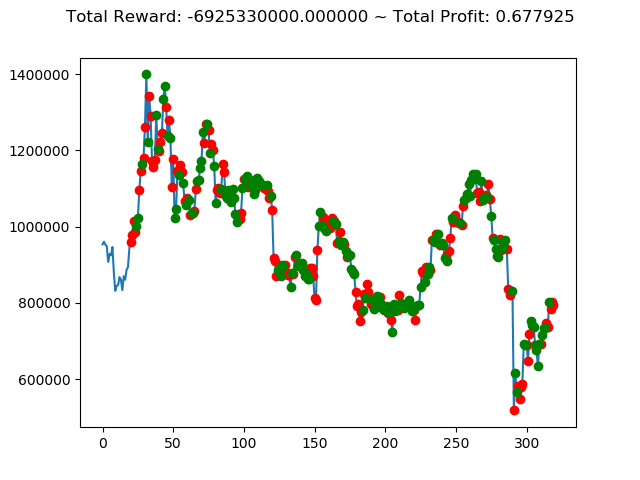
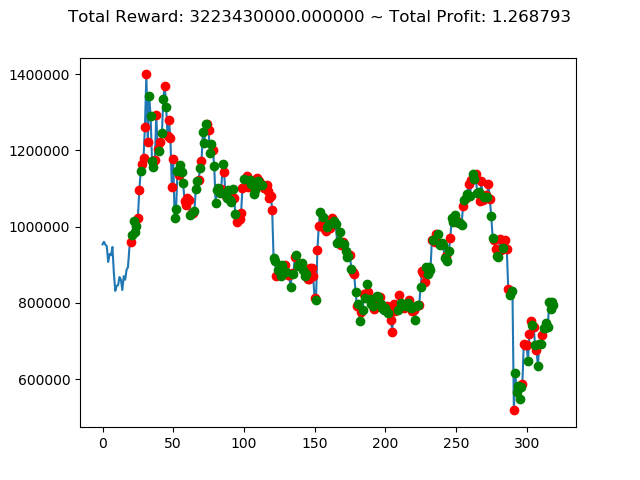
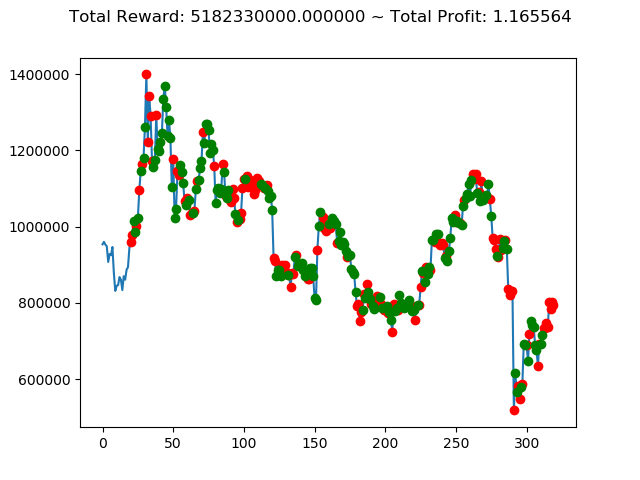
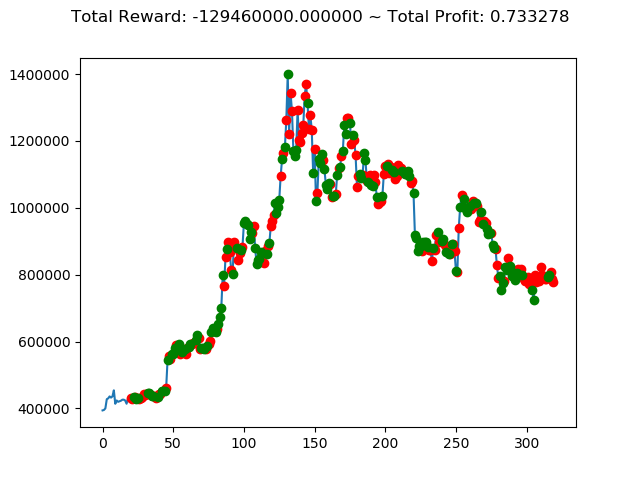
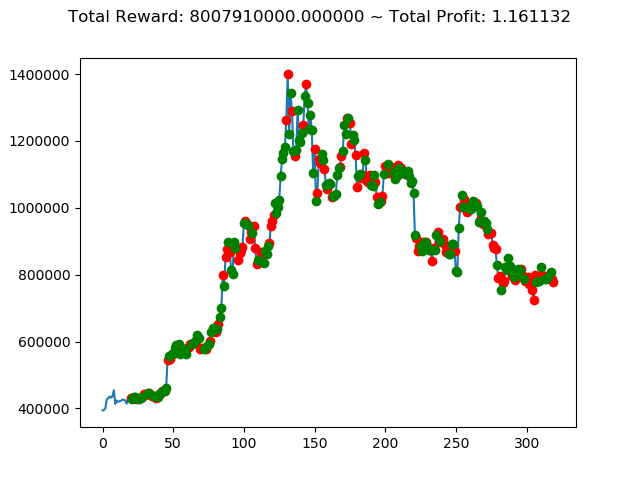
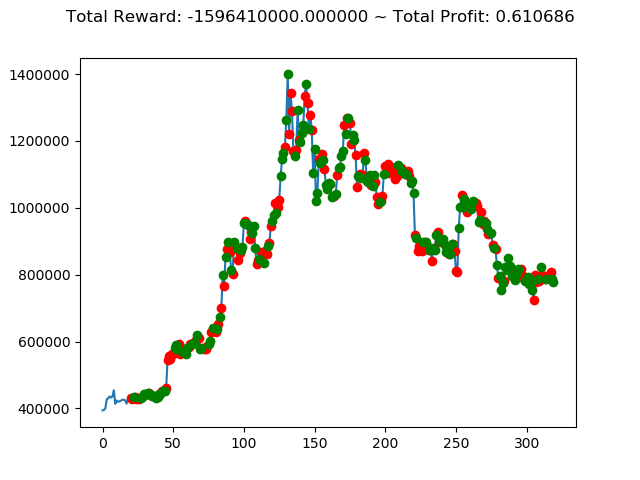
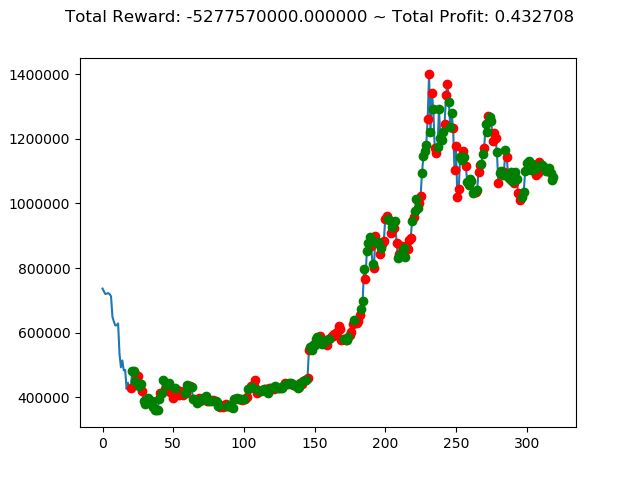
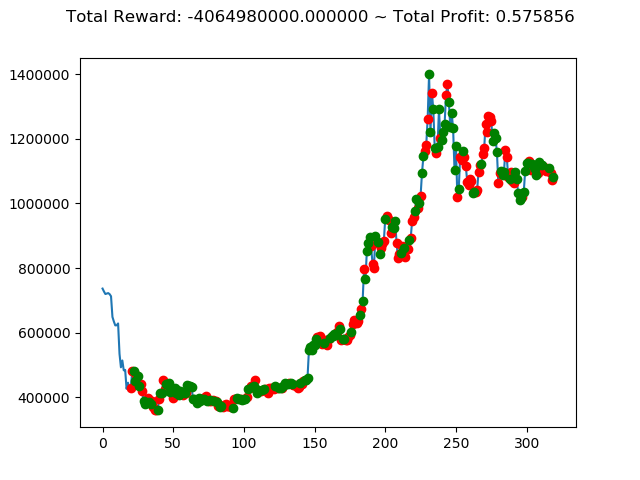
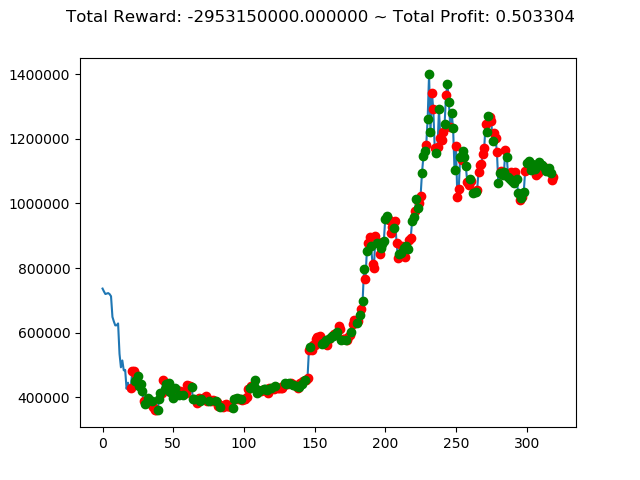
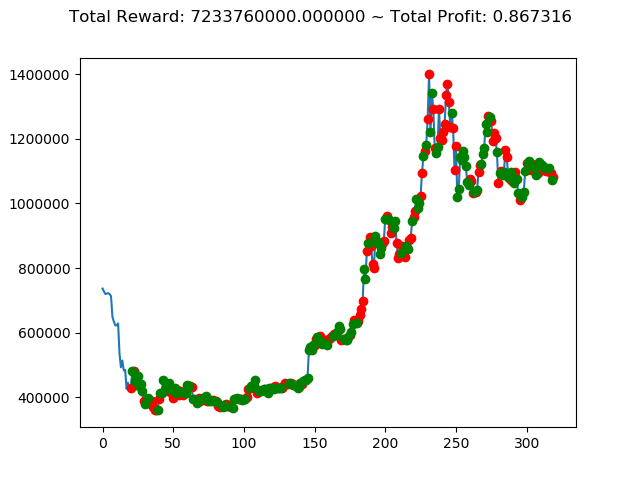
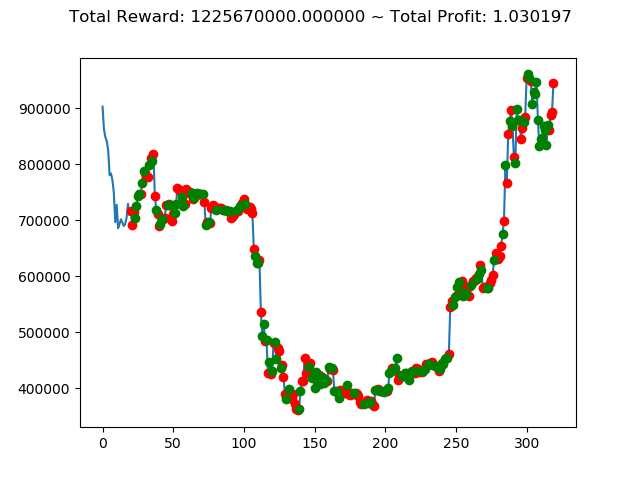
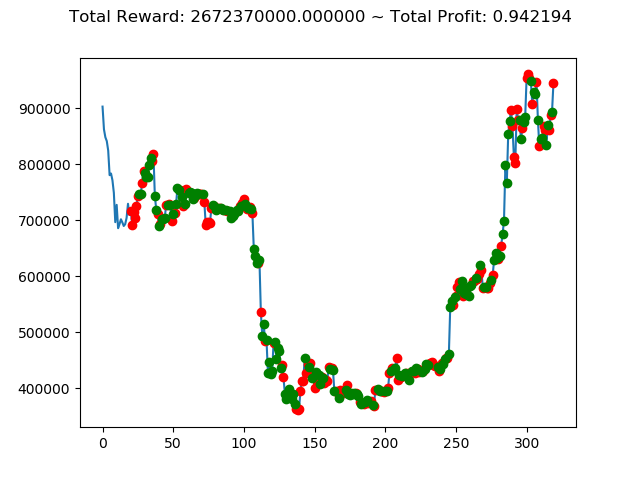
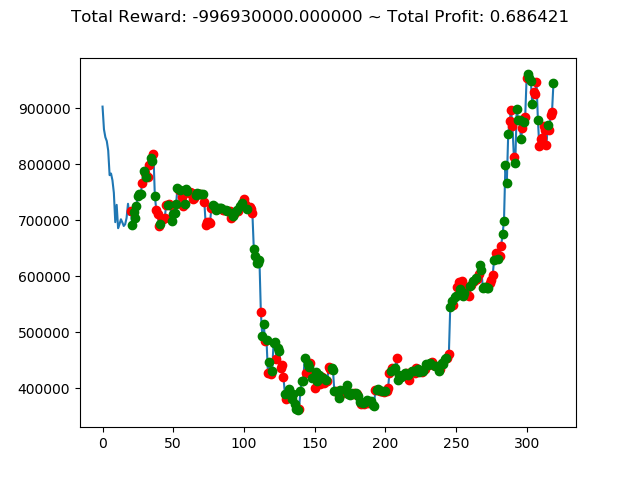
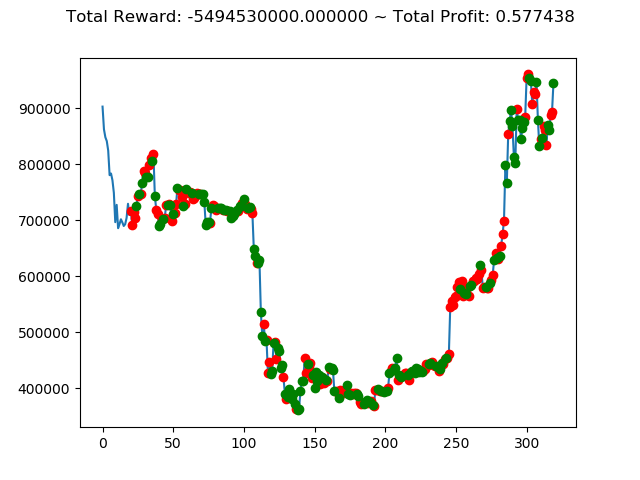
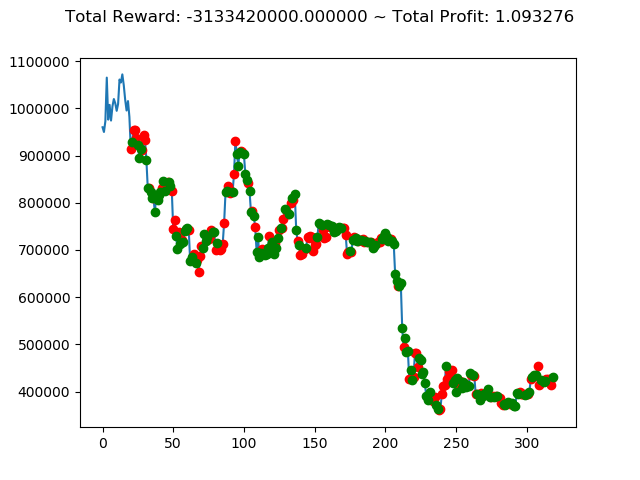
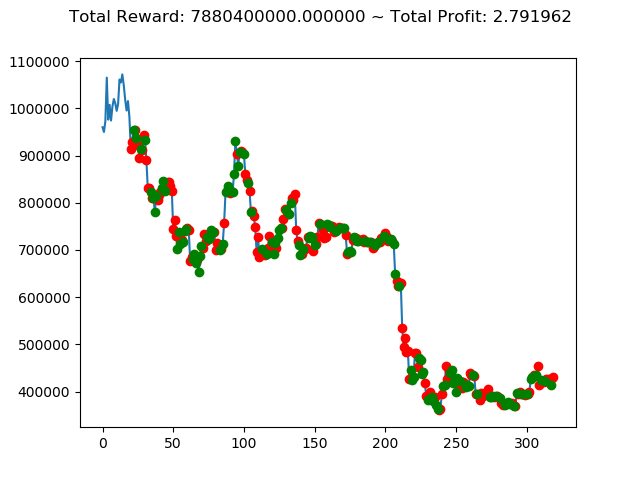
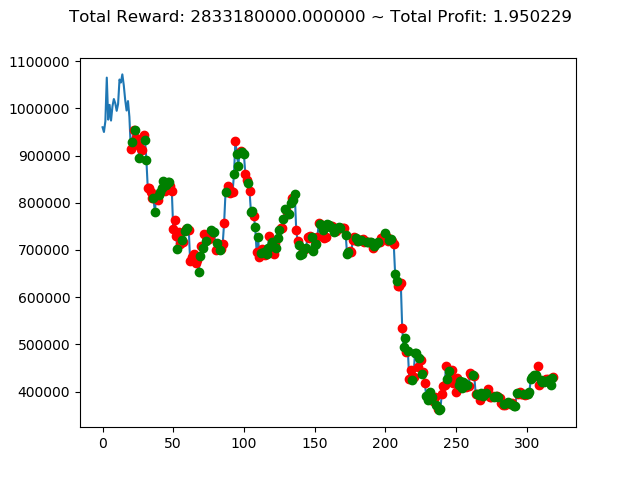
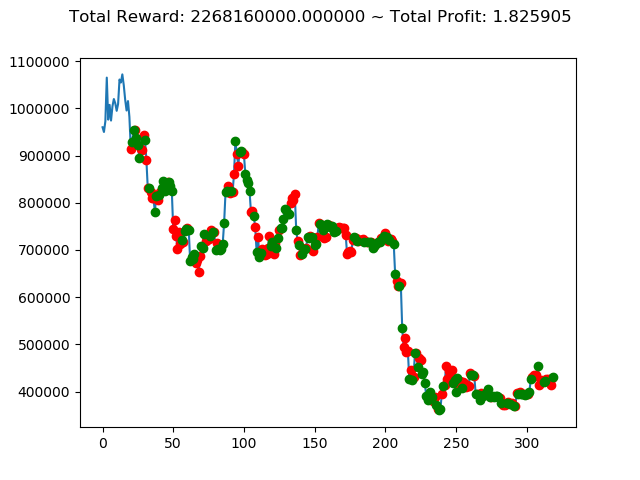
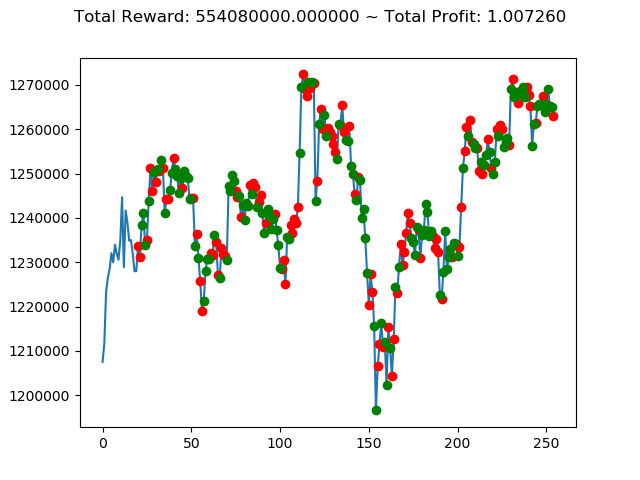
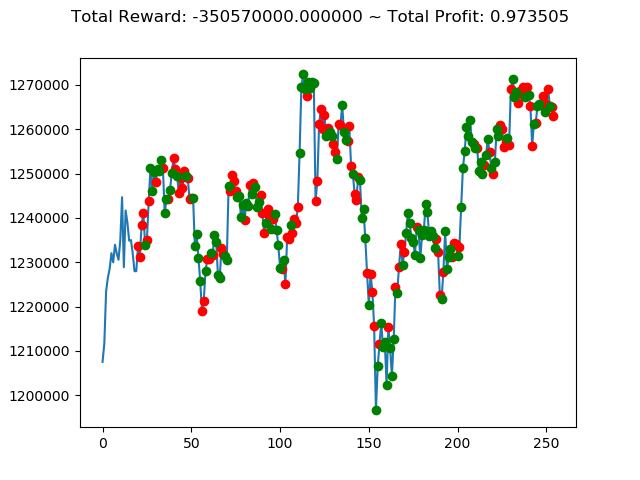
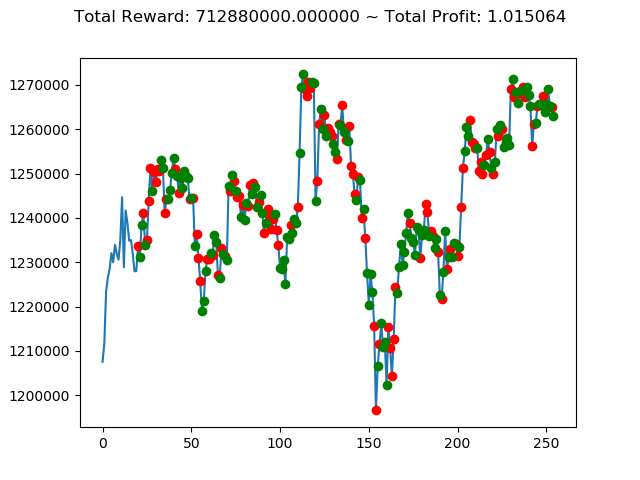
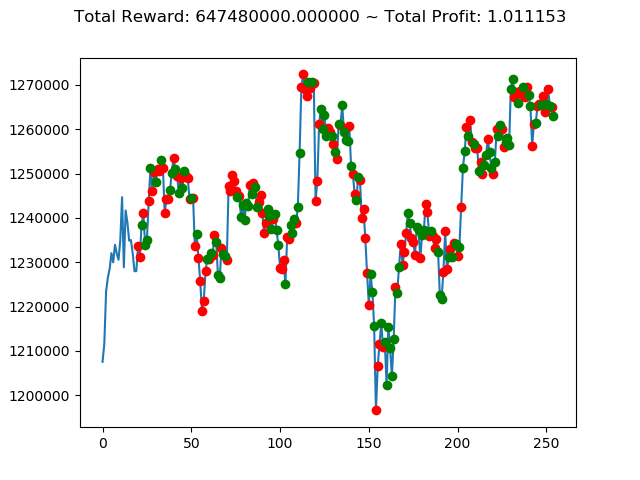
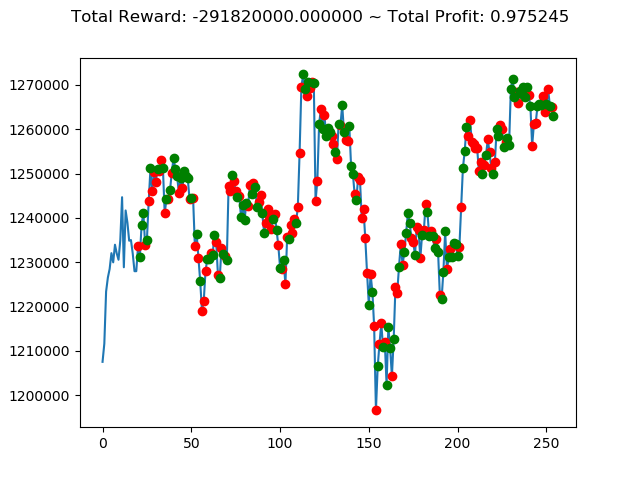
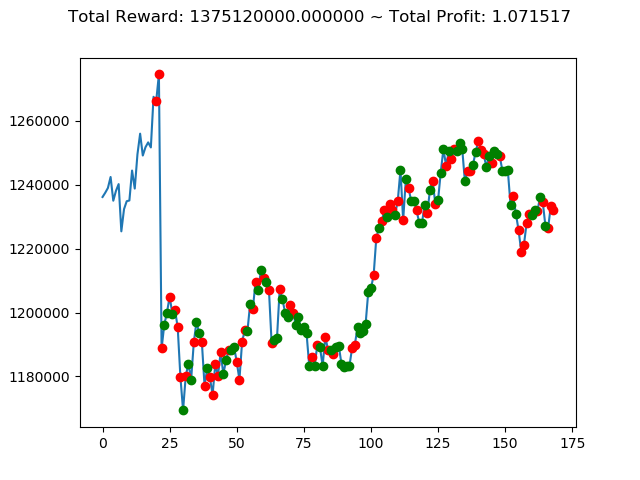
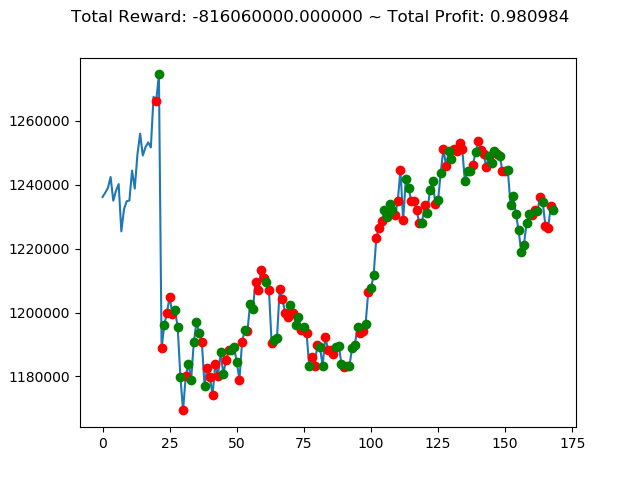
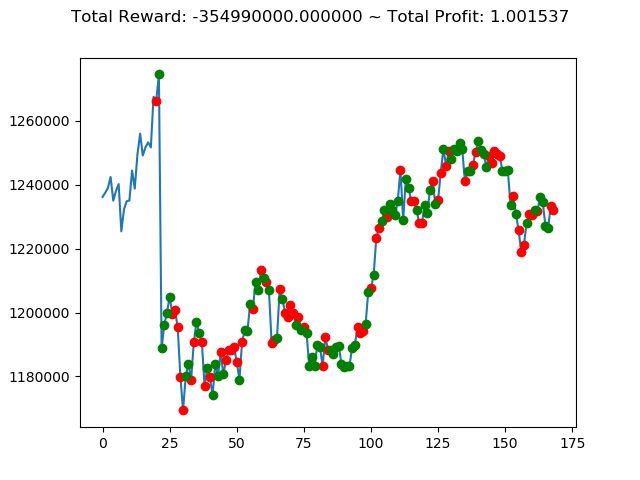
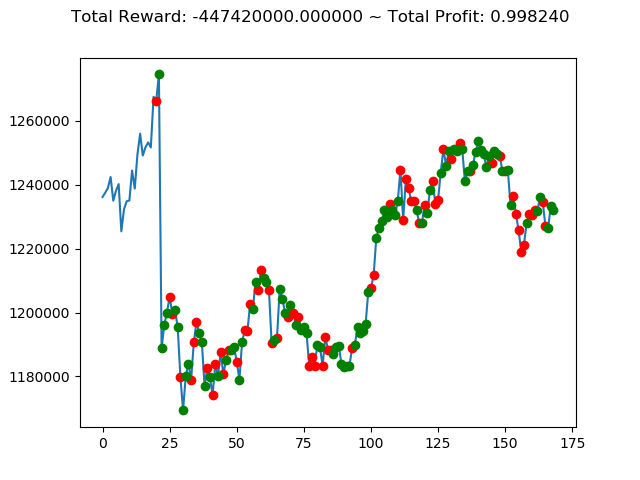
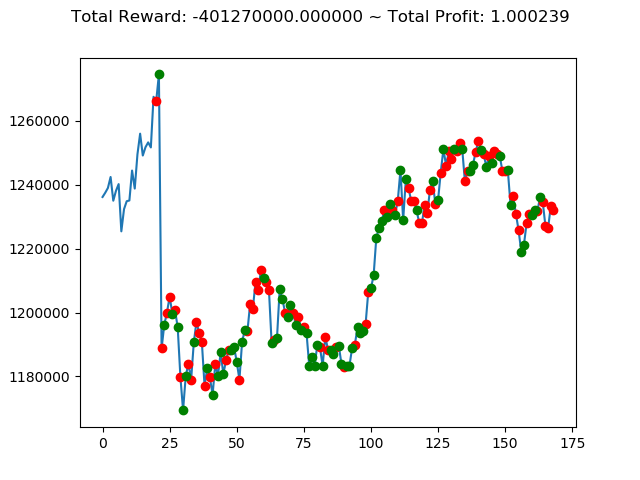
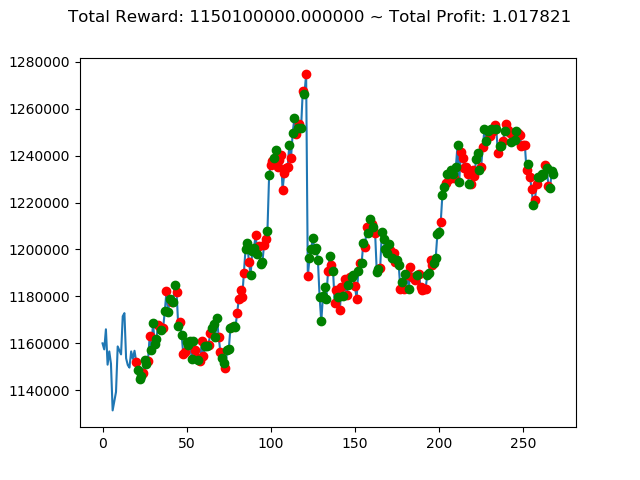
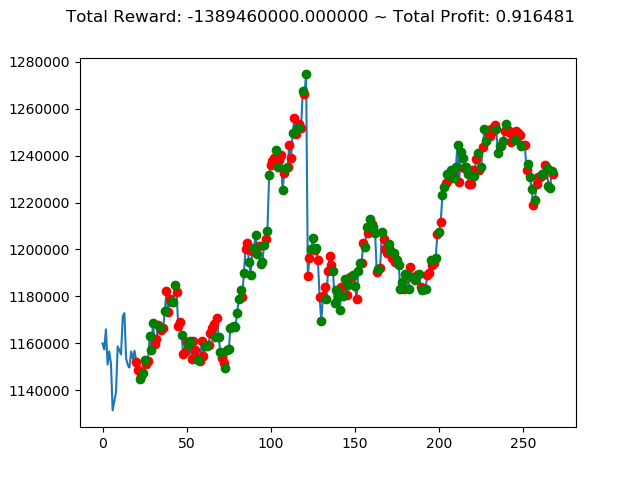
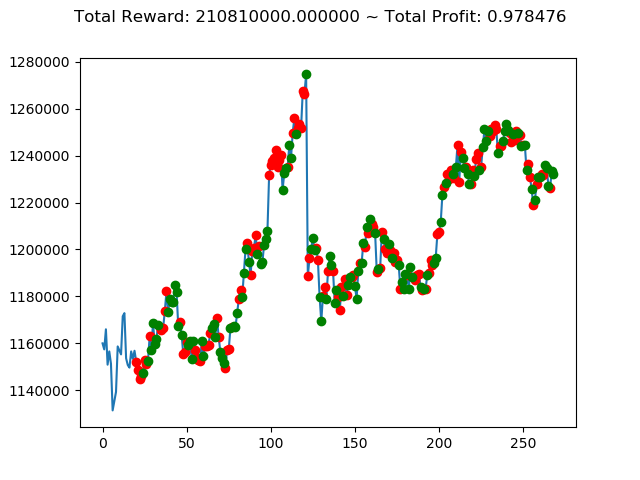
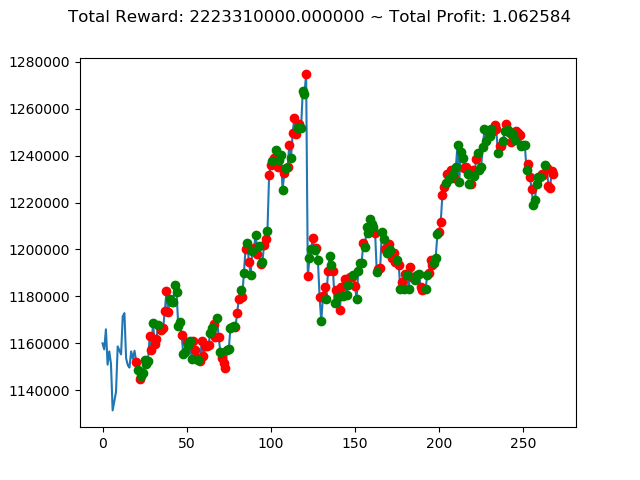
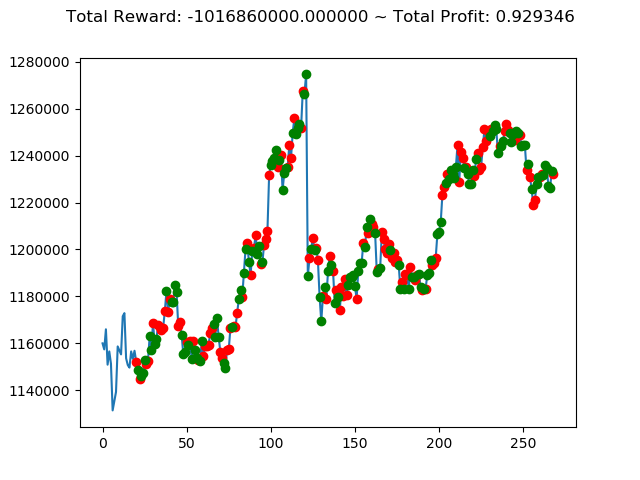
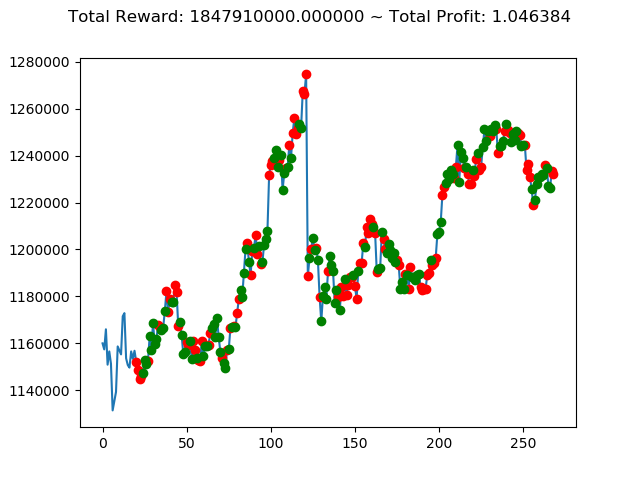
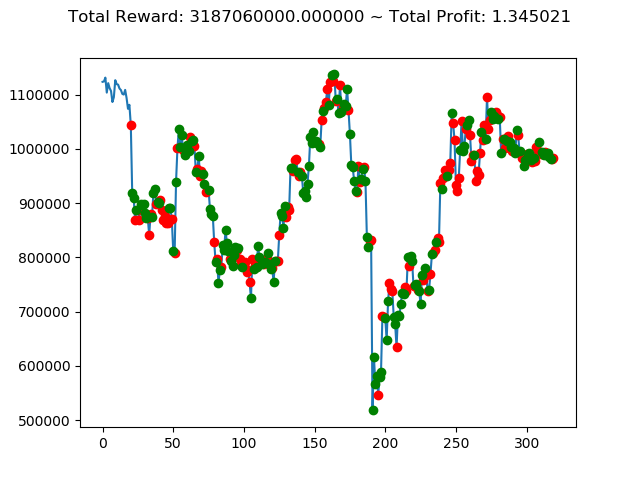
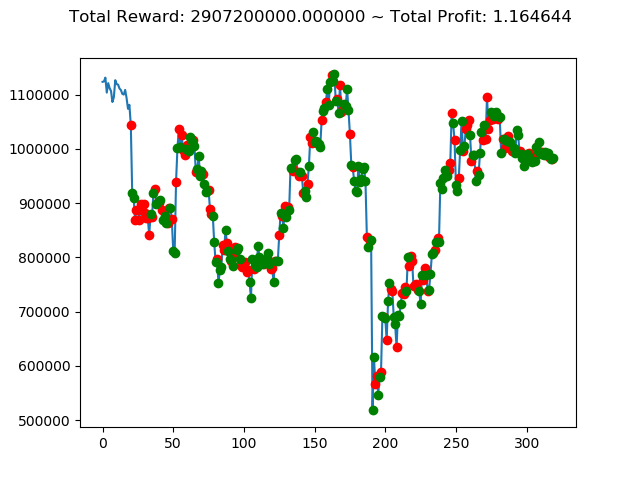
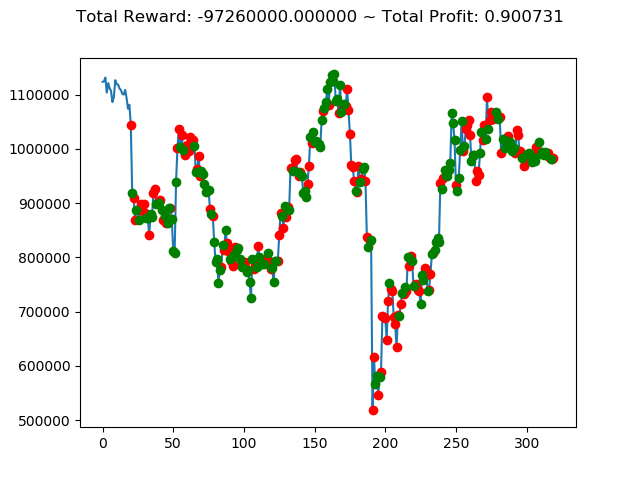
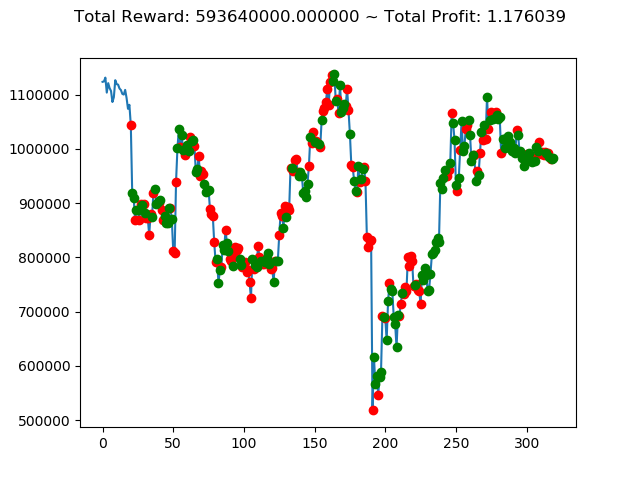
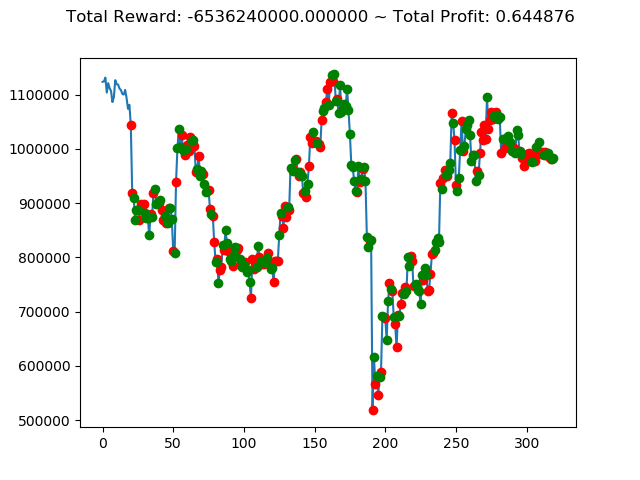
[出力画像]
これまでの投資結果(トータル報酬)を表にまとめてみます。
| No. | トータル報酬(5回前) | トータル報酬(4回前) | トータル報酬(3回前) | トータル報酬(2回前) | トータル報酬(前回) | トータル報酬(今回) |
|---|---|---|---|---|---|---|
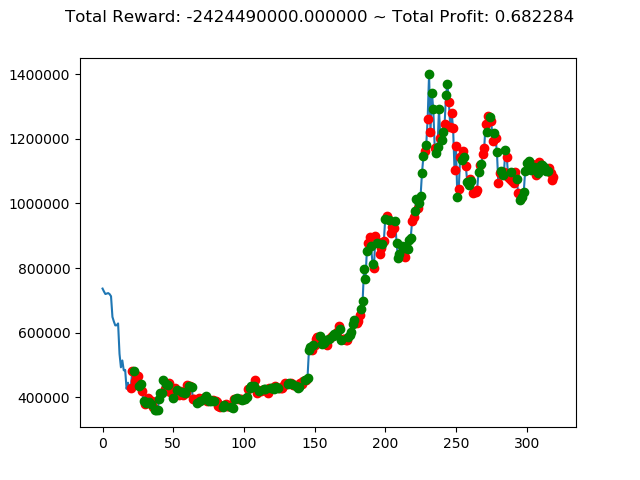
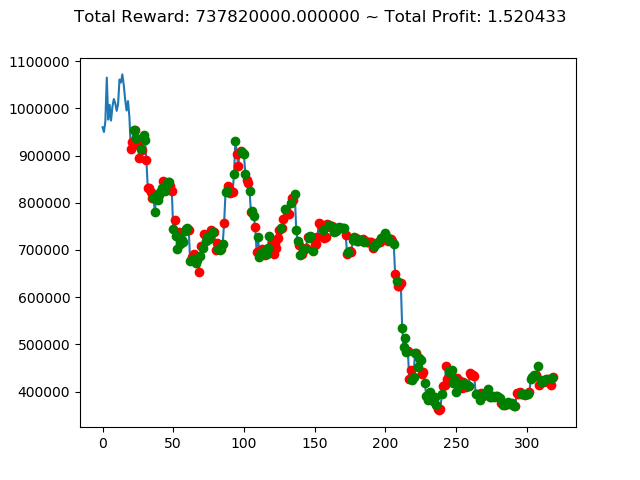
| ① | 737,820,000円 | 1,225,670,000円 | -2,424,490,000円 | -129,460,000円 | 3,543,310,000円 | 2,554,510,000円 |
| ② | 4,451,760,000円 | 2,672,370,000円 | -3,870,060,000円 | 8,007,910,000円 | -1,553,380,000円 | 3,187,060,000円 |
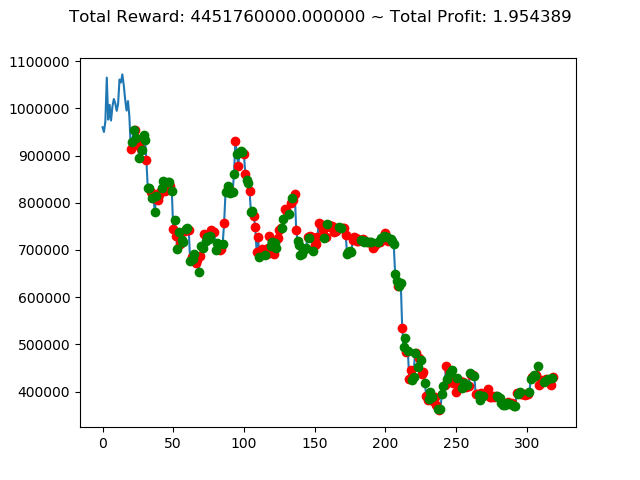
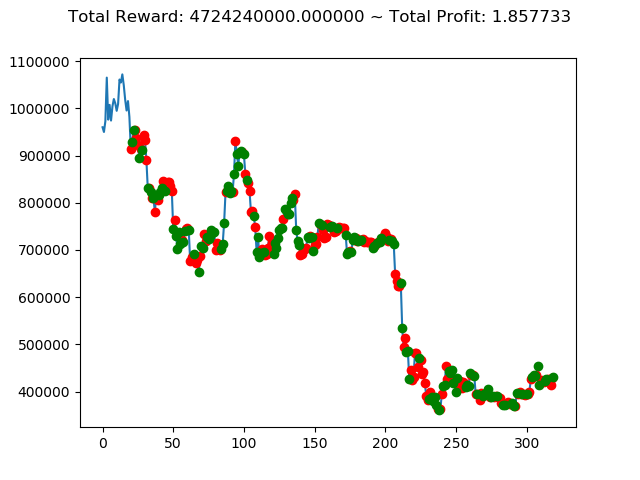
| ③ | 4,724,240,000円 | -996,930,000円 | -5,277,570,000円 | -1,596,410,000円 | -11,847,060,000円 | 2,907,200,000円 |
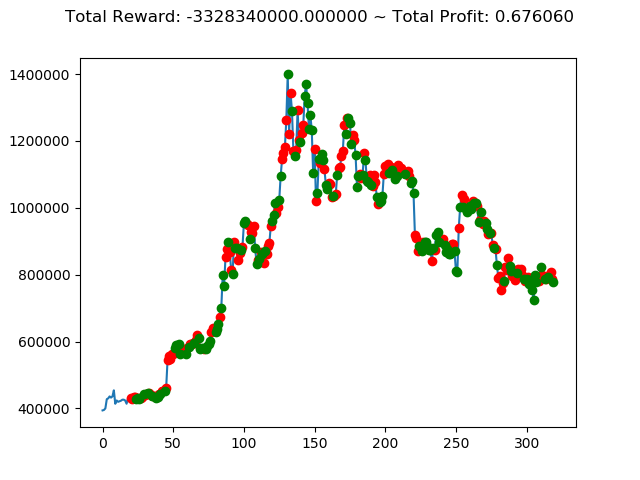
| ④ | -3,133,420,000円 | -5,494,530,000円 | -4,064,980,000円 | -3,328,340,000円 | -5,097,430,000円 | -97,260,000円 |
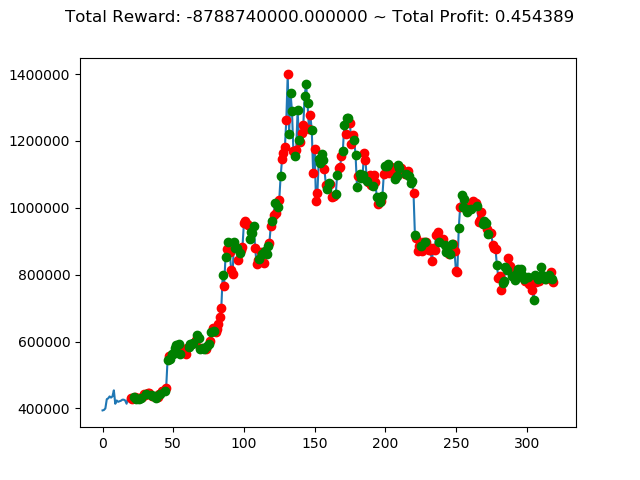
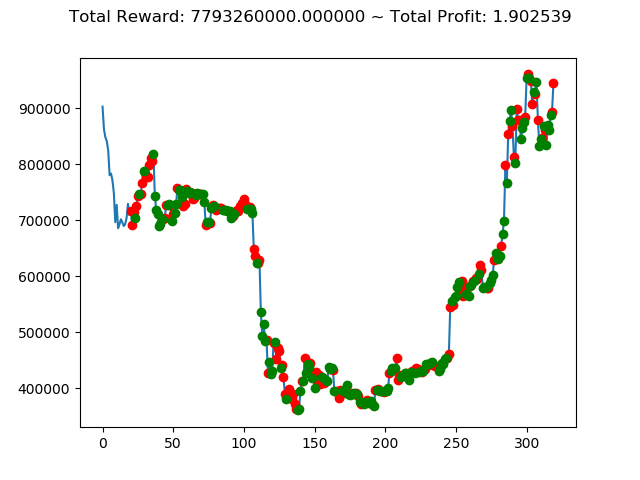
| ⑤ | 7,880,400,000円 | 7,793,260,000円 | -2,953,150,000円 | -8,788,740,000円 | 4,813,240,000円 | 593,640,000円 |
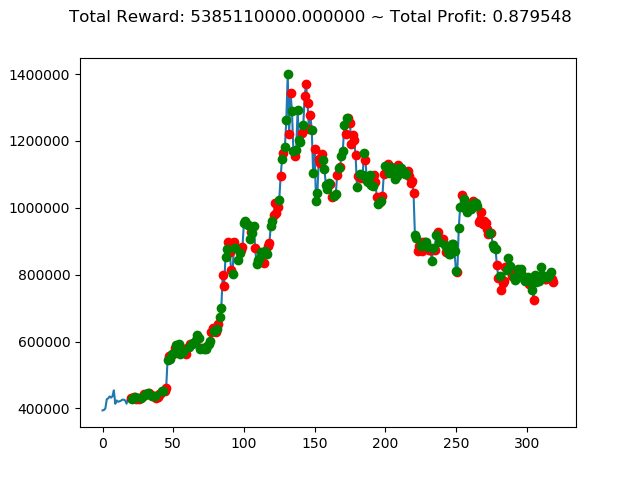
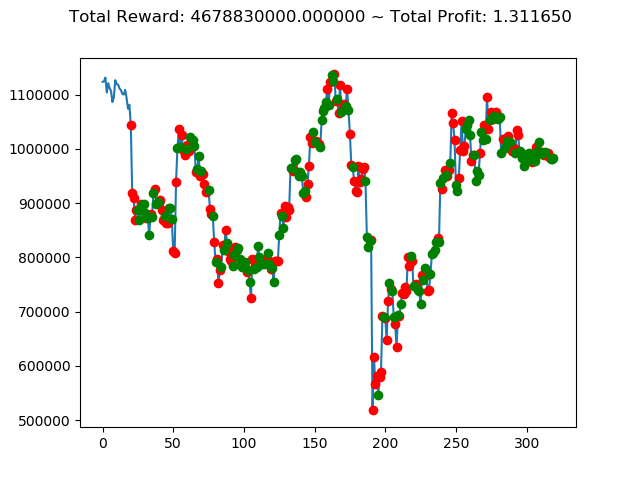
| ⑥ | 2,833,180,000円 | -2,393,360,000円 | 7,233,760,000円 | 5,385,110,000円 | 145,830,000円 | 4,678,830,000円 |
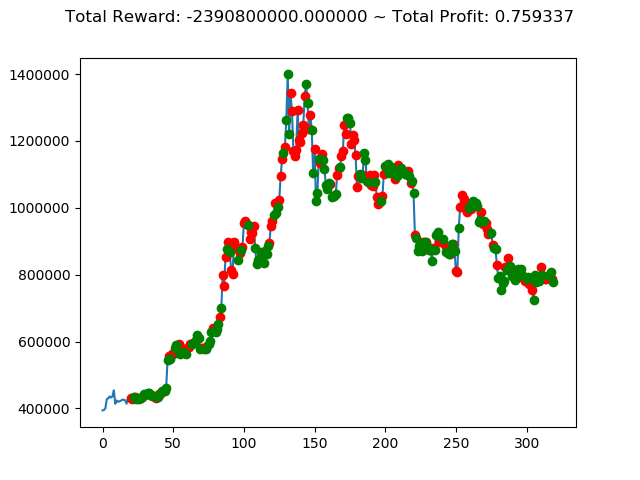
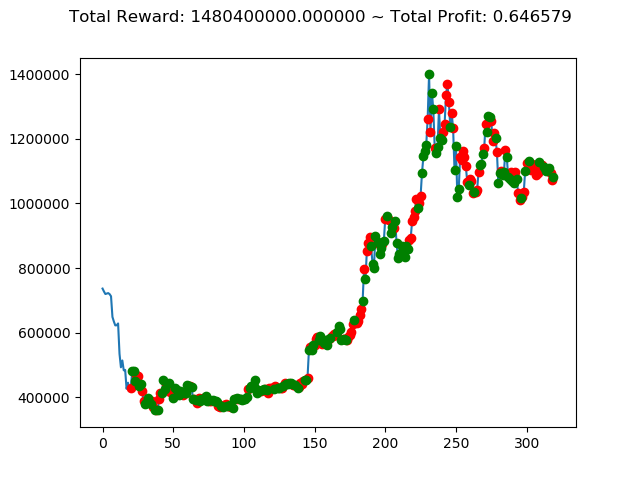
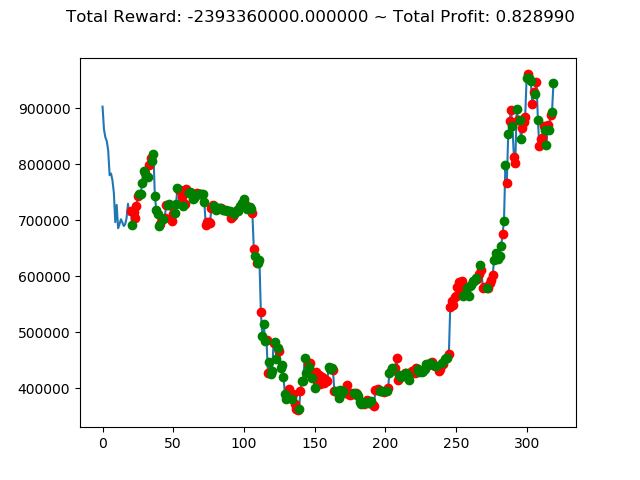
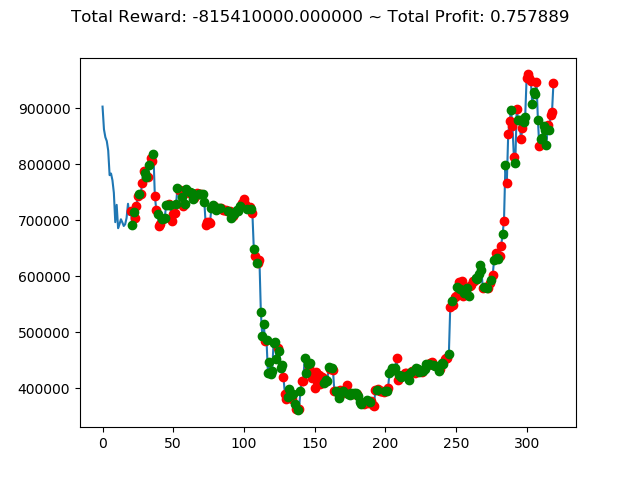
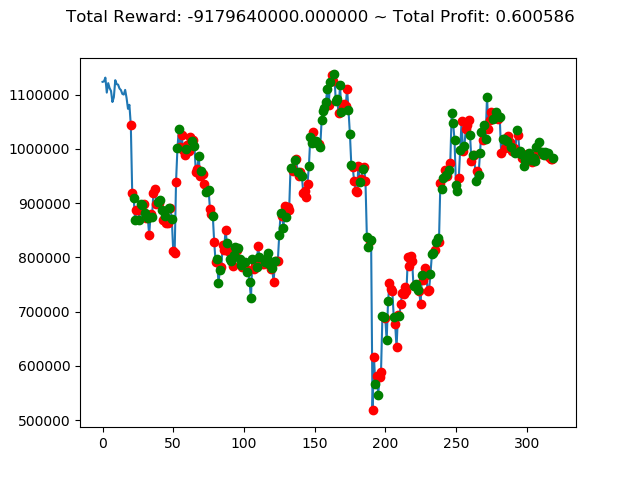
| ⑦ | 2,268,160,000円 | -815,410,000円 | 1,480,400,000円 | -2,390,800,000円 | -6,559,180,000円 | -9,179,640,000円 |
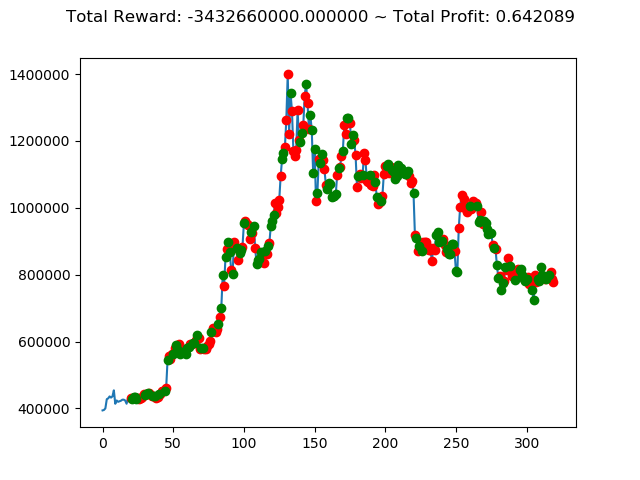
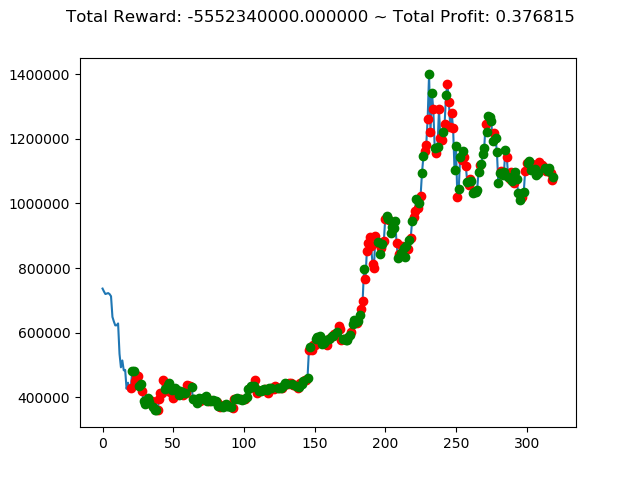
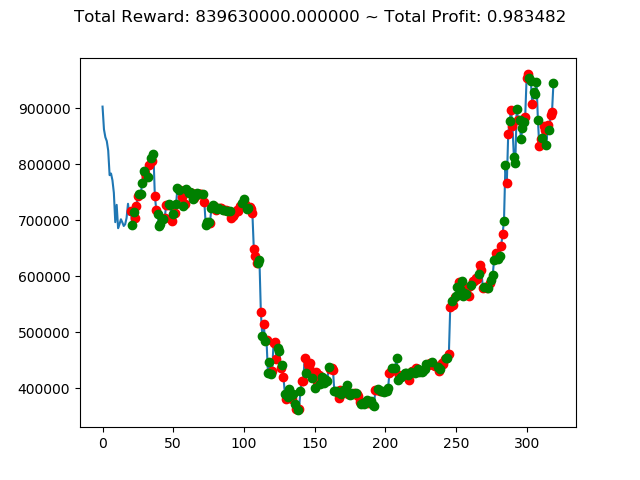
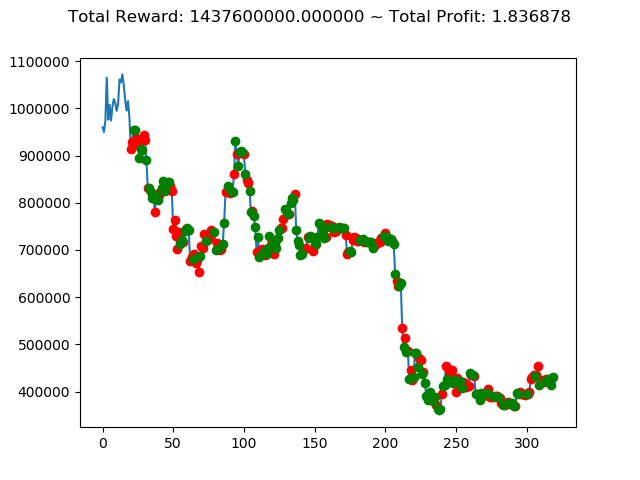
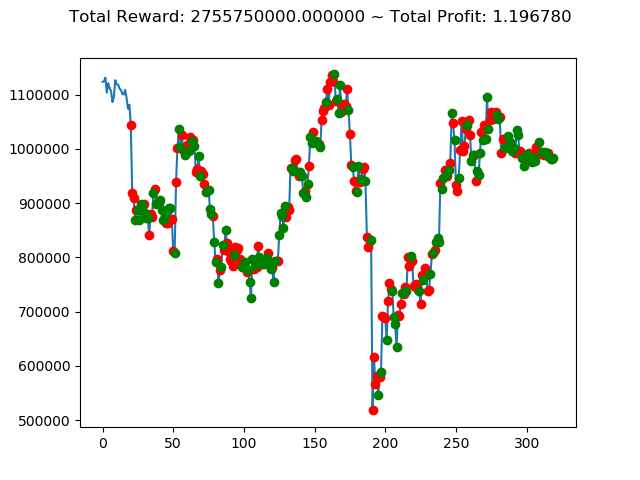
| ⑧ | 1,437,600,000円 | 839,630,000円 | -5,552,340,000円 | -3,432,660,000円 | -6,925,330,000円 | 2,755,750,000円 |
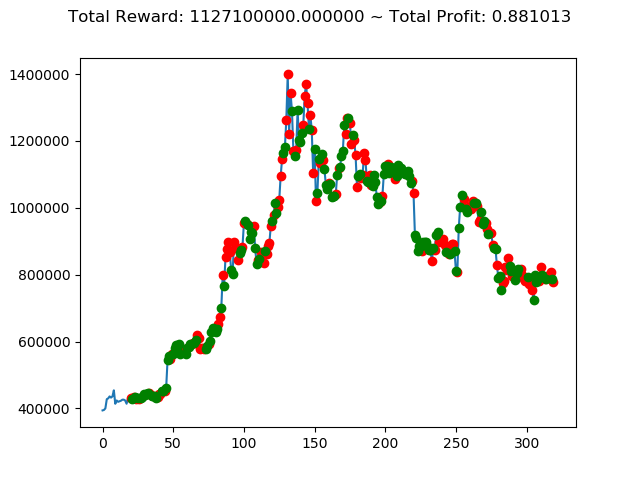
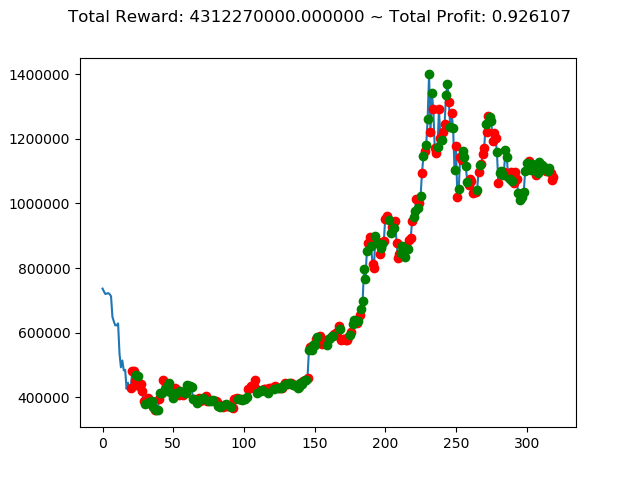
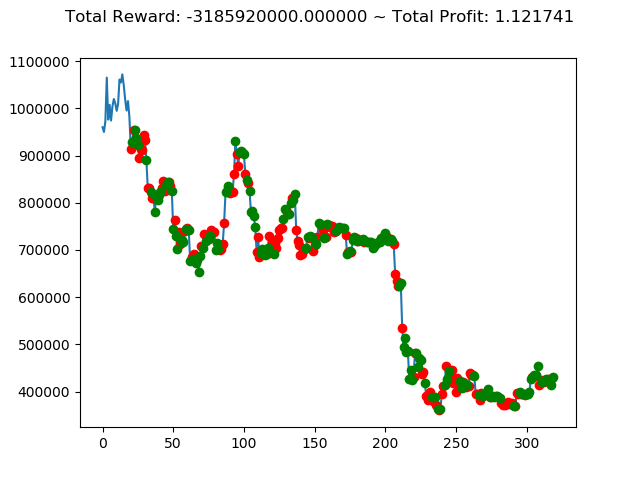
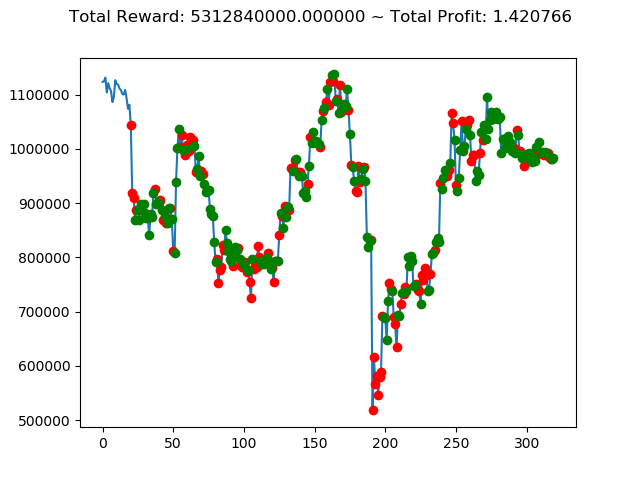
| ⑨ | -3,185,920,000円 | 2,794,730,000円 | 4,312,270,000円 | 1,127,100,000円 | 3,223,430,000円 | 5,312,840,000円 |
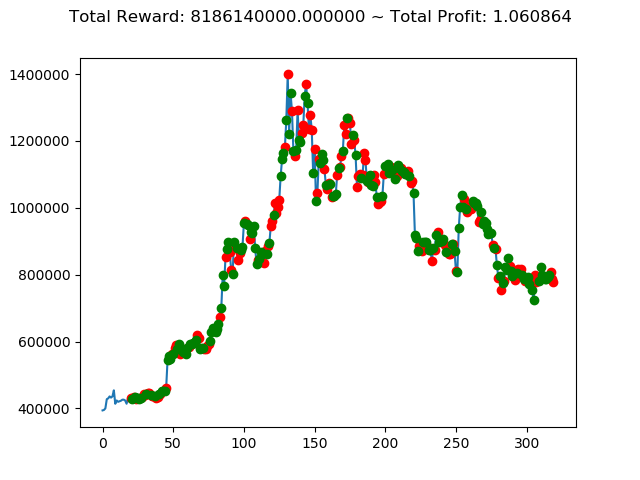
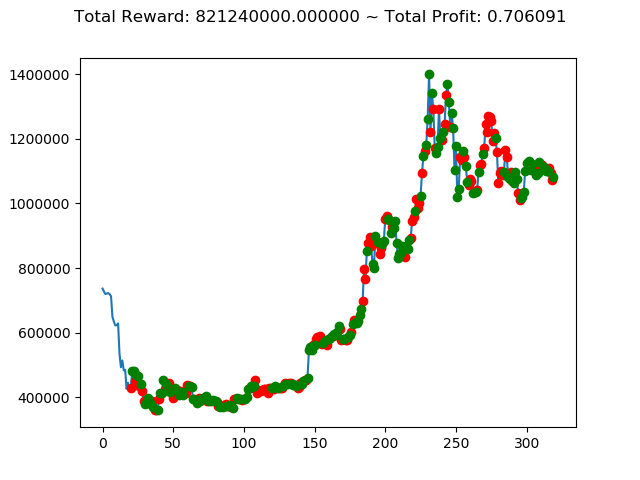
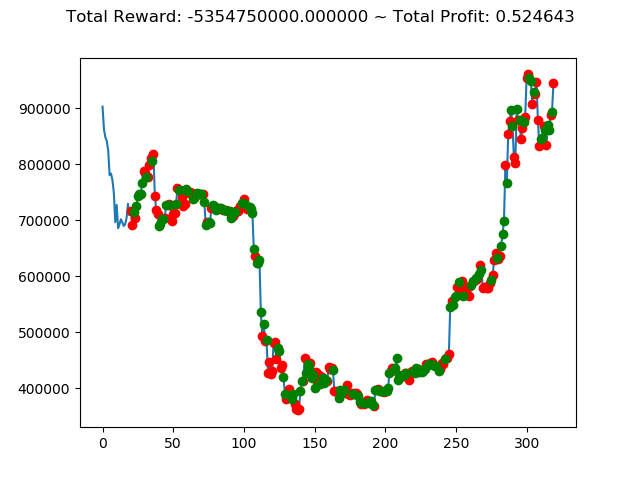
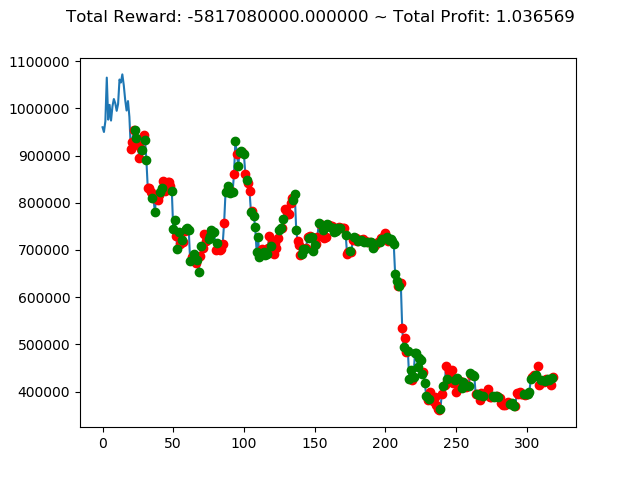
| ⑩ | -5,817,080,000円 | -5,354,750,000円 | 821,240,000円 | 8,186,140,000円 | 5,182,330,000円 | -6,536,240,000円 |
10種類の学習済みモデルは、7勝3敗となかなかの成績となりました。
学習モデルごとの結果としては、No⑥、No⑨が5勝1敗となかなかの好成績となっています。