Excelのセル情報取得
Cellオブジェクト には、セルの情報を参照するための プロパティ があります。
| プロパティ | 内容 |
|---|---|
| row | 行を示す整数値。 |
| column | 列を示す文字列。 |
| coordinate | セル番地を示す文字列。 |
| value | セルの値 |
それぞれの プロパティ を参照したサンプルコードは以下の通りです。
[Google Colaboratory]
1 | import openpyxl |
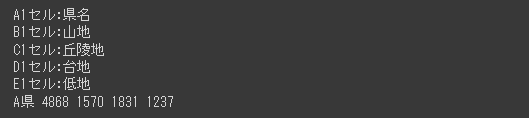
読み込むエクセルファイルは下記になります。
[テスト.xlsx]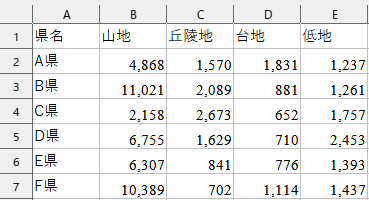
[実行結果]
各プロパティの内容を取得することができました。