1
2
3
4
5
6
7
8
9
10
11
12
13
14
15
16
17
18
19
20
21
22
23
24
25
26
27
28
29
30
31
32
33
34
35
36
37
38
39
40
41
42
43
44
45
46
47
48
49
50
51
52
53
54
55
56
57
58
| import openpyxl
from openpyxl.chart import BarChart, Series, Reference
book = openpyxl.Workbook()
sheet = book.active
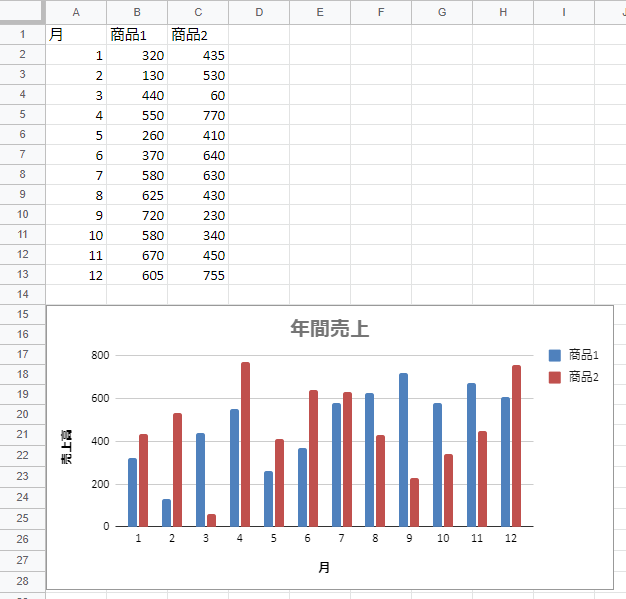
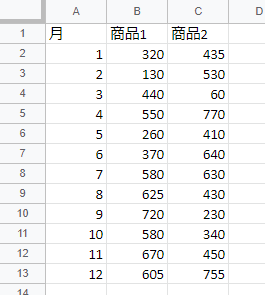
rows = [
('月', '商品1', '商品2'),
(1, 320, 435),
(2, 130, 530),
(3, 440, 60),
(4, 550, 770),
(5, 260, 410),
(6, 370, 640),
(7, 580, 630),
(8, 625, 430),
(9, 720, 230),
(10, 580, 340),
(11, 670, 450),
(12, 605, 755),
]
for row in rows:
sheet.append(row)
chart1 = BarChart()
chart1.type = 'col'
chart1.style = 10
chart1.title = '年間売上'
chart1.y_axis.title = '売上高'
chart1.x_axis.title = '月'
data = Reference(sheet,
min_col=2,
min_row=1,
max_col=3,
max_row=13
)
cats = Reference(sheet,
min_col=1,
min_row=2,
max_row=13)
chart1.add_data(data, titles_from_data=True)
chart1.set_categories(cats)
sheet.add_chart(chart1,
'A15'
)
book.save('Test.xlsx')
|