円柱
円柱の方程式は一般的に以下のように表されます:
$$
x^2 + y^2 = r^2
$$
ここで、$( r ) $は円柱の半径を表します。
円柱の方程式をPythonでグラフ化するためには、MatplotlibとNumPyを使用します。
具体的なコード例を示します:
1 | import numpy as np |
このコードでは、円柱の方程式 $ ( x^2 + y^2 = r^2 ) $を使用して円柱の表面をプロットしています。
円柱の半径 $( r ) $を変更することで、円柱のサイズを調整することができます。
グラフは3次元で表示され、円柱の構造が視覚化されます。
[実行結果]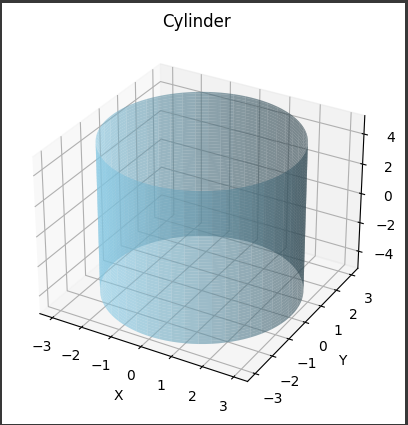
ソースコード解説
ソースコードの詳細を説明します。
1. NumPyの利用:
1 | import numpy as np |
Matplotlibはデータ可視化のためのPythonライブラリであり、mpl_toolkits.mplot3dモジュールは3次元プロットのための機能を提供します。
3. 円柱の半径を設定:
1 | r = 3 |
円柱の半径 $ ( r ) $を設定します。
この値を変更すると、描画される円柱のサイズが変わります。
4. メッシュグリッドの作成:
1 | theta = np.linspace(0, 2*np.pi, 100) |
np.linspace関数を使用して角度 $( \theta ) $と高さ $( z ) $の範囲を定義し、np.meshgrid関数でメッシュグリッドを作成します。
そして、円柱の表面の$ ( x ) $座標と$ ( y ) $座標を計算します。
5. 3Dプロットの作成:
1 | fig = plt.figure() |
plt.figure()で新しい図を作成し、fig.add_subplot(111, projection='3d')で3次元サブプロットを追加します。
ax.plot_surface()で円柱の表面をプロットします。
6. グラフの設定:
1 | ax.set_xlabel('X') |
軸ラベルやタイトルなど、グラフの表示設定を行います。
7. グラフの表示:
1 | plt.show() |
最後に plt.show() を呼び出してグラフを表示します。
これにより、円柱の表面が3次元グラフとして描画されます。
円柱の側面は青色で描かれ、透明度は$0.6$に設定されています。
円柱の底面や側面の形状が視覚的に表現され、円柱の構造がわかりやすくなります。