クリスマスプレゼントの最適化問題
クリスマスプレゼントの最適化問題では、予算内で最大の満足度 を得るプレゼントを選ぶことが求められます。
価格 と満足度 が与えられると、この問題を解くことができます。
以下はその一例です。
1
2
3
4
5
6
7
8
9
10
11
12
13
14
15
16
17
18
19
20
21
22
23
24
25
26
27
28
29
30
31
32
33
34
35
36
37
38
39
40
41
42
43
44
45
import matplotlib.pyplot as pltimport numpy as npprices = [10 , 20 , 30 , 40 , 50 ] satisfaction = [3 , 7 , 9 , 12 , 15 ] budget = 70 def max_satisfaction (prices, satisfaction, budget ): n = len (prices) dp = np.zeros((n + 1 , budget + 1 ), dtype=int ) for i in range (1 , n + 1 ): for j in range (budget + 1 ): if prices[i - 1 ] <= j: dp[i][j] = max (dp[i - 1 ][j], satisfaction[i - 1 ] + dp[i - 1 ][j - prices[i - 1 ]]) else : dp[i][j] = dp[i - 1 ][j] selected = [] i, j = n, budget while i > 0 and j > 0 : if dp[i][j] != dp[i - 1 ][j]: selected.append(i - 1 ) j -= prices[i - 1 ] i -= 1 return dp[n][budget], selected[::-1 ] max_value, selected_items = max_satisfaction(prices, satisfaction, budget) print ("Maximum satisfaction:" , max_value)print ("Selected items indices:" , selected_items)plt.figure(figsize=(8 , 6 )) plt.bar(selected_items, [satisfaction[i] for i in selected_items], label='Selected Items' ) plt.xlabel('Item Index' ) plt.ylabel('Satisfaction' ) plt.title('Selected Gifts for Max Satisfaction within Budget' ) plt.legend() plt.grid(True ) plt.show()
この例では、与えられた価格 と満足度 のデータから、与えられた予算内で最大の満足度 を持つプレゼントを選択し、それをグラフ化して表示します。
[実行結果]
ソースコード解説
このPythonコードは、特定の予算内で最大の満足度 を得るプレゼントを選択する問題を解くものです。
この問題は、動的計画法 を用いて解いています。
以下に各部分の詳細な説明を記載します。
1. 必要なライブラリのインポート: 1 2 import matplotlib.pyplot as pltimport numpy as np
ここでは、matplotlib とnumpy の二つのライブラリをインポートしています。
matplotlib はデータの視覚化を行うためのライブラリで、numpy は数値計算を行うためのライブラリです。
2. サンプルの価格と満足度データの設定: 1 2 prices = [10 , 20 , 30 , 40 , 50 ] satisfaction = [3 , 7 , 9 , 12 , 15 ]
ここでは、5つのプレゼントの価格とそれぞれの満足度をリストとして設定しています。
3. 予算の設定: ここでは、プレゼントの選択に使用できる予算を設定しています。
4. 最適なプレゼントを選択する関数の定義: 1 2 def max_satisfaction (prices, satisfaction, budget ): ...
ここでは、最適なプレゼントを選択 する関数を定義しています。
この関数は、プレゼントの価格 、満足度 、予算 を引数として取り、最大の満足度 とその満足度 を達成するためのプレゼントのインデックスを返します。
5. 最適なプレゼントを選択し、結果を出力: 1 2 3 max_value, selected_items = max_satisfaction(prices, satisfaction, budget) print ("Maximum satisfaction:" , max_value)print ("Selected items indices:" , selected_items)
ここでは、先ほど定義した関数を使用して最適なプレゼント を選択し、その結果を出力しています。
6. 選択したプレゼントの満足度をグラフ化: 1 2 3 4 5 6 7 8 plt.figure(figsize=(8 , 6 )) plt.bar(selected_items, [satisfaction[i] for i in selected_items], label='Selected Items' ) plt.xlabel('Item Index' ) plt.ylabel('Satisfaction' ) plt.title('Selected Gifts for Max Satisfaction within Budget' ) plt.legend() plt.grid(True ) plt.show()
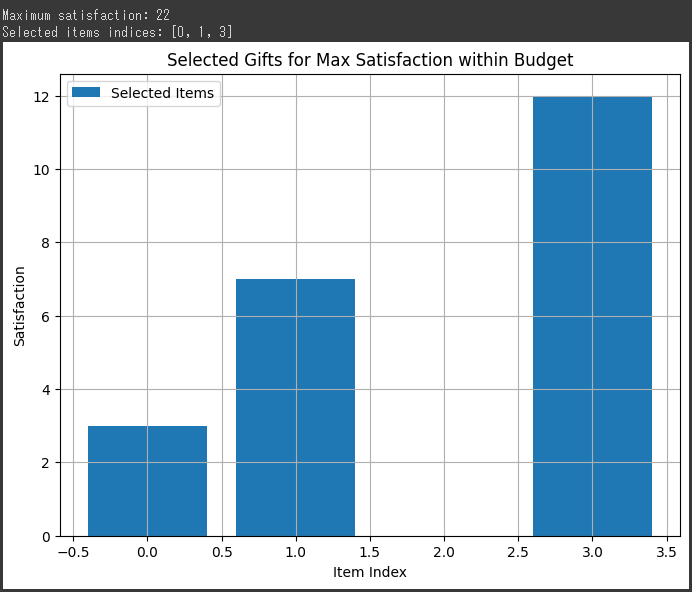
ここでは、選択したプレゼントの満足度を棒グラフ として視覚化しています。
x軸はプレゼントのインデックス 、y軸は満足度 を表しています。
結果解説
[実行結果]
このグラフは、予算内で選択されたプレゼントの満足度 を示しています。
横軸は選択されたアイテムのインデックス を表し、縦軸はそれぞれのアイテムの満足度 を示しています。
この例では、与えられた予算内で最大の満足度を持つプレゼント を選択しました。
グラフ上の棒の高さは、各アイテムが与える満足度 を表しており、選択されたアイテムの棒 が強調されています。
この選択されたアイテムセットが、予算内で最大の総満足度 を提供するように選ばれたものです。
このように、与えられた条件下で最適なプレゼント を選択することができます。