PyScript⑫(Matplotlib)

Matplotlib

PyScript内から、Matplotlibを使って折れ線グラフを表示します。

まずpy-configタグにmatplotlibを指定し、PyScriptタグでmatplotlibライブラリをインポートします。

そしてpy-script内で、matplotlibライブラリを使って単純な折れ線グラフを描画し、最後にdisplay関数を使ってHtml上に折れ線グラフを表示します。

[ソースコード]

plotly1.html
1
2
3
4
5
6
7
8
9
10
11
12
13
14
15
16
17
18
19
20
21
22
<html>
<head>
<link rel="stylesheet" href="https://pyscript.net/latest/pyscript.css" />
<script defer src="https://pyscript.net/latest/pyscript.js"></script>
</head>

<body>
<div id="mpl"></div>

<py-config>
packages = ["matplotlib"]
</py-config>

<py-script>
import matplotlib.pyplot as plt
data = [2, 4, 6, 3, 5, 8, 4, 5]
plt.plot(data)
display(plt, target="mpl")
</py-script>

</body>
</html>

[ブラウザ表示]

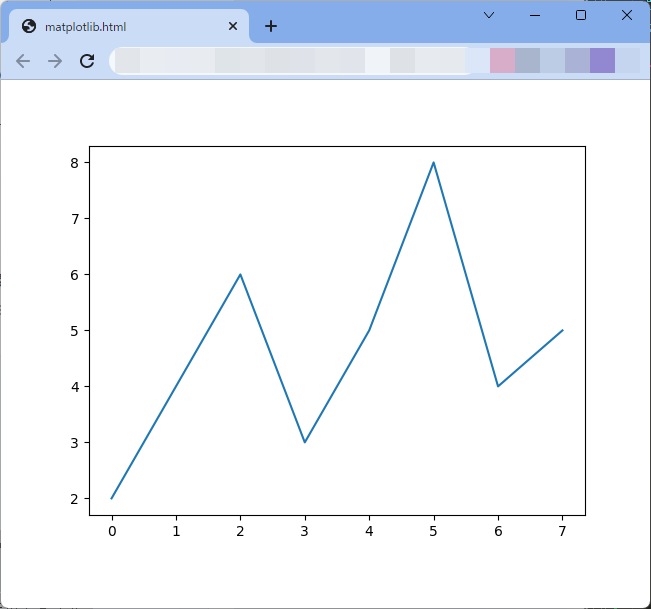
PyScript内で作成したmatplotlibの図形オブジェクトを、ブラウザ上で表示することができました。