t-SNEにとって重要なパラメータであるPerplexityの最適値を調べます。
Perplexityとは、どれだけ近傍の点を考慮するかを決めるためのパラメータであり、データの局所的な特性と全体的な特性のどちらをより考慮するかというバランスを表します。
デフォルトは30であり、5から50の間の値を選択することが推奨されています。
複数のPerplexityを設定して結果を確認することが、基本的なアプローチになります。
最適なPerplexityを探索 (2次元)
最適なPerplexityを調べるための関数を定義し、結果を2次元で表示します。
(前回読み込んだMNISTデータを使用しています)
[Google Colaboratory]
1
2
3
4
5
6
7
8
9
10
11
12
13
14
15
16
17
| import time
def create_2d_tsne(target_X, y, y_labels, perplexity_list= [2, 5, 30, 50, 100]):
fig, axes = plt.subplots(nrows=1, ncols=len(perplexity_list),figsize=(5*len(perplexity_list), 4))
for i, (ax, perplexity) in enumerate(zip(axes.flatten(), perplexity_list)):
start_time = time.time()
tsne = TSNE(n_components=2, random_state=0, perplexity=perplexity)
Y = tsne.fit_transform(target_X)
for each_label in y_labels:
c_plot_bool = y == each_label
ax.scatter(Y[c_plot_bool, 0], Y[c_plot_bool, 1], label="{}".format(each_label))
end_time = time.time()
ax.legend()
ax.set_title("perplexity: {}".format(perplexity))
print("perplexity {} is {:.2f} seconds.".format(perplexity, end_time - start_time))
plt.show()
create_2d_tsne(digits.data, digits.target, digits.target_names)
|
定義した関数の引数には次の3パラメータを設定します。
Perplexityにそれぞれ2,5,30,50,100を設定(2行目)し、t-SNEを実行(6,7行目)します。
それぞれの結果を2次元で可視化したものが下記になります。
[実行結果]
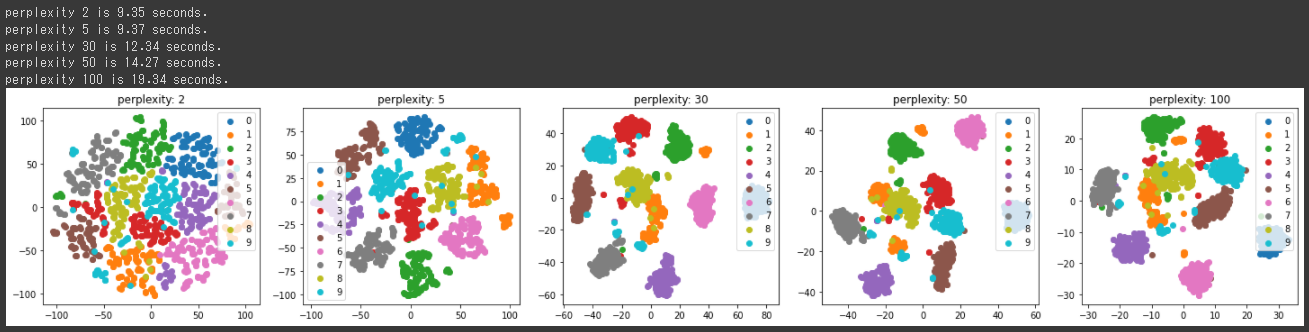
2次元ではPerplexityが30,50の時に、うまく分類されていることが分かりました。
t-SNEの結果を3次元表示
今度は3次元で、最適なPerplexityを調べるための関数を定義します。
[Google Colaboratory]
1
2
3
4
5
6
7
8
9
10
11
12
13
14
15
16
17
| def create_3d_tsne(target_X, y, y_labels, perplexity_list= [2, 5, 30, 50, 100]):
fig = plt.figure(figsize=(5*len(perplexity_list),4))
for i, perplexity in enumerate(perplexity_list):
ax = fig.add_subplot(1, len(perplexity_list), i+1, projection="3d")
start_time = time.time()
tsne = TSNE(n_components=3, random_state=0, perplexity=perplexity)
Y = tsne.fit_transform(target_X)
for each_label in y_labels:
c_plot_bool = y == each_label
ax.scatter(Y[c_plot_bool, 0], Y[c_plot_bool, 1], label="{}".format(each_label))
end_time = time.time()
ax.legend()
ax.set_title("Perplexity: {}".format(perplexity))
print("perplexity {} is {:.2f} seconds.".format(perplexity, end_time - start_time))
plt.show()
create_3d_tsne(digits.data, digits.target, digits.target_names)
|
projectionパラメータに“3d”を設定(4行目)し、3次元のグラフを表示します。
また、n_componentsパラメータを2から3に変更しています。(6行目)
[実行結果]
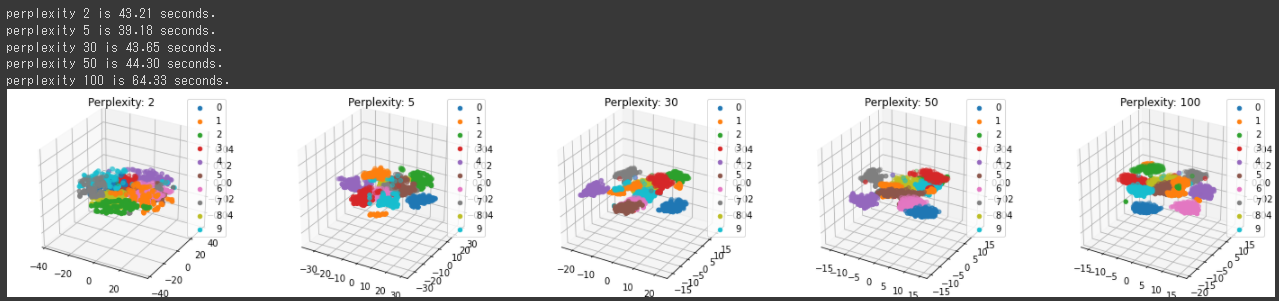
3次元の表示からは、Perplexityが30の方がより特徴ごとに分かれているようです。
今回はPerplexityのデフォルト値である30でうまく分類できることが分かりましたが、データセットによって最適なPerplexityの設定値が異なりますので、今回実施したように複数の結果を作成し比較することをお勧めします。

