Dash VTK①(イントロダクション)

Dash VTKとは

Dash VTKは、VTKによるビジュアライゼーションをDashフレームワークの中で実現します。

VTKVisualization Toolkitを意味しており、主に医療分野でのデータビジュアライゼーションを実現するライブラリです。

特にシミュレーションやセンサーからのデータを、3次元に表現する際によく使われています。

インストール

Dash VTKをインストールするためには、次のコマンドを実行します。

[コマンド]

1
pip install dash_vtk

サンプル

Dash VTKを使った最も簡単なサンプルコードは下記の通りです。

[ソースコード]

1
2
3
4
5
6
7
8
9
10
11
12
13
14
15
16
17
18
19
20
21
22
23
24
25
26
27
28
29
30
31
32
33
34
35
36
37
38
39
import dash
import dash_html_components as html

import dash_vtk
from dash_vtk.utils import to_mesh_state

try:
# VTK 9+
from vtkmodules.vtkImagingCore import vtkRTAnalyticSource
except ImportError:
# VTK =< 8
from vtk.vtkImagingCore import vtkRTAnalyticSource

# Use VTK to get some data
data_source = vtkRTAnalyticSource()
data_source.Update() # <= Execute source to produce an output
dataset = data_source.GetOutput()

# Use helper to get a mesh structure that can be passed as-is to a Mesh
# RTData is the name of the field
mesh_state = to_mesh_state(dataset)

content = dash_vtk.View([
dash_vtk.GeometryRepresentation([
dash_vtk.Mesh(state=mesh_state)
]),
])

# Dash setup
app = dash.Dash(__name__)
server = app.server

app.layout = html.Div(
style={"width": "100%", "height": "400px"},
children=[content],
)

if __name__ == "__main__":
app.run_server(debug=True)

[ブラウザで表示]

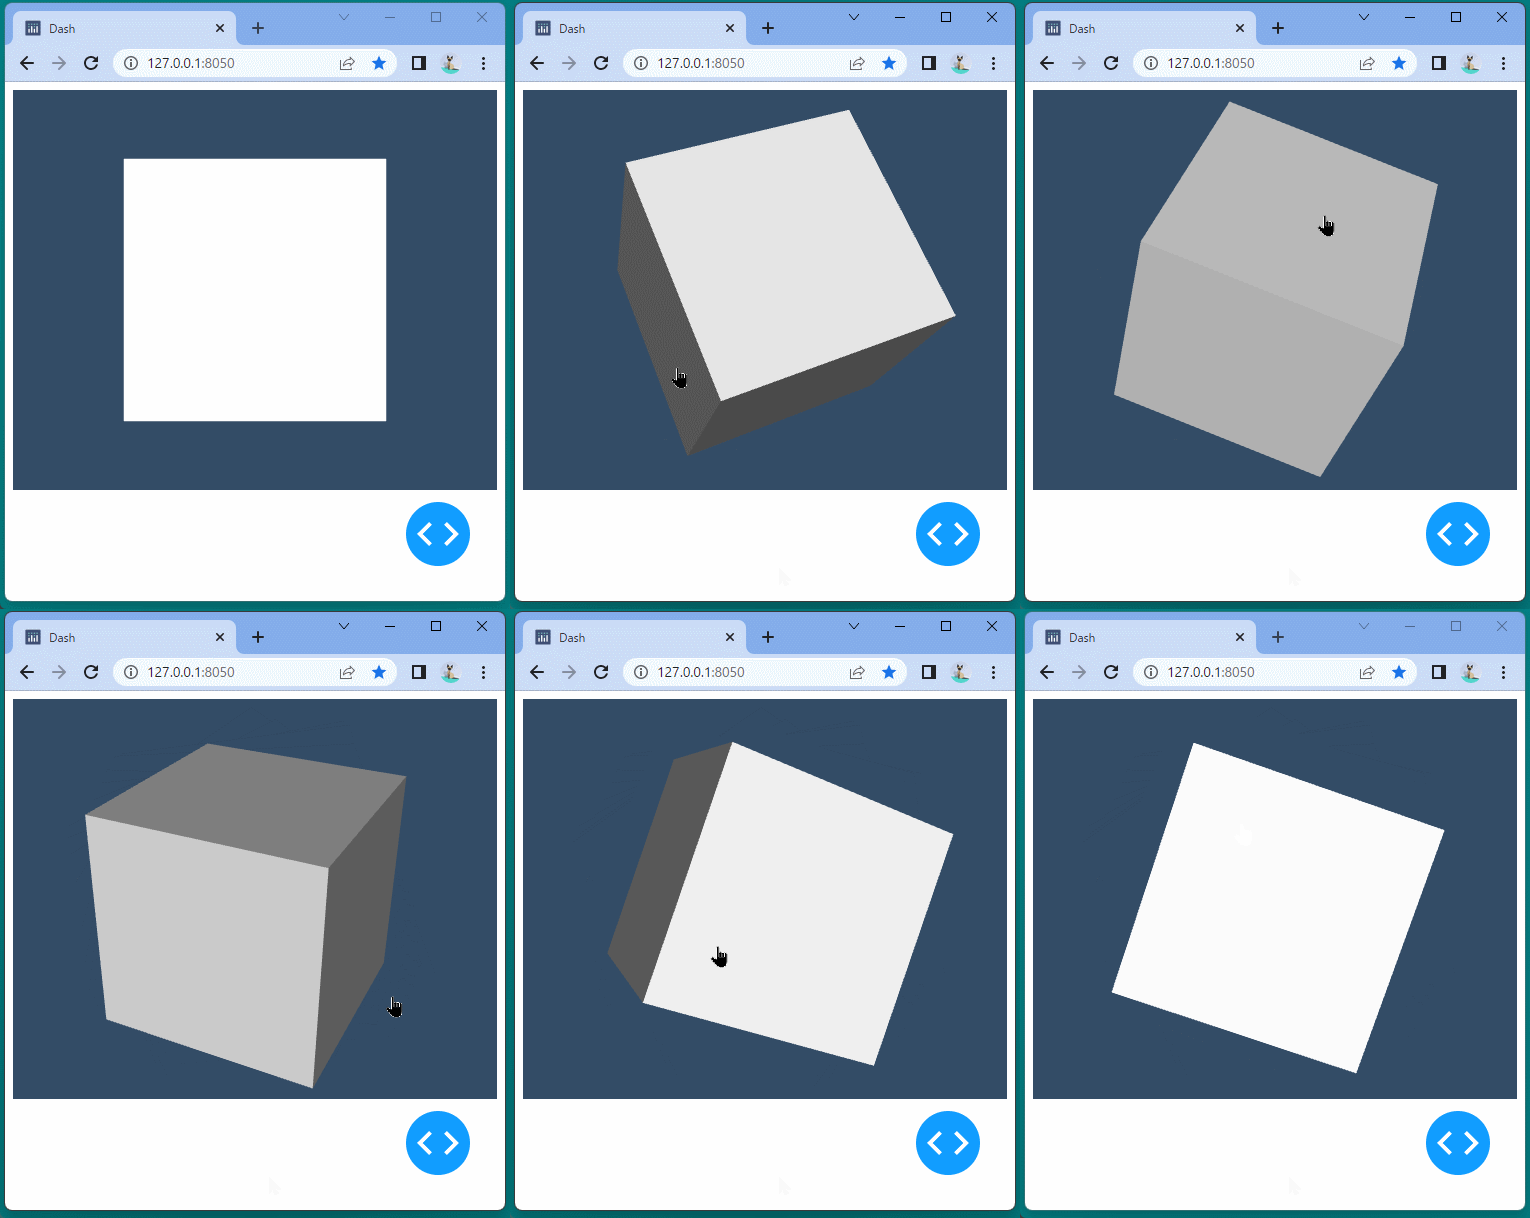
立方体が表示され、ドラッグすると角度を変えて表示することができます。

Dash Cytoscape⑳(イベントコールバック/mouseoverEdgeData)

イベントコールバック/mouseoverEdgeData

mouseoverEdgeDataを使うと、カーソルをのせたエッジのデータ辞書を取得することができます。

コールバック関数の入力(Input)にmouseoverEdgeDataを指定します。(41行目)

[ソースコード]

1
2
3
4
5
6
7
8
9
10
11
12
13
14
15
16
17
18
19
20
21
22
23
24
25
26
27
28
29
30
31
32
33
34
35
36
37
38
39
40
41
42
43
44
45
46
47
import json

import dash
import dash_cytoscape as cyto
import dash_html_components as html
import dash_core_components as dcc
from dash.dependencies import Input, Output

app = dash.Dash(__name__)

nodes = [
{'data': {'id': short, 'label': label} }
for short, label in (
('la', 'Los Angeles'), ('nyc', 'New York'), ('to', 'Toronto'),
('mtl', 'Montreal'), ('van', 'Vancouver'), ('chi', 'Chicago'),
('bos', 'Boston'), ('hou', 'Houston')
)
]

edges = [
{'data': {'source': source, 'target': target}}
for source, target in (
('van', 'la'), ('la', 'chi'), ('hou', 'chi'),
('to', 'mtl'), ('mtl', 'bos'), ('nyc', 'bos'),
('to', 'hou'), ('to', 'nyc'), ('la', 'nyc'),
('nyc', 'bos')
)
]

app.layout = html.Div([
cyto.Cytoscape(
id='cytoscape-event',
layout={'name': 'circle'},
elements=edges+nodes,
style={'width': '100%', 'height': '450px'}
),
html.Pre(id='show_json')
])

@app.callback(Output('show_json', 'children'),
Input('cytoscape-event', 'mouseoverEdgeData'))
def displayData(data):
return json.dumps(data, indent=2)

if __name__ == '__main__':
app.run_server(debug=True)

取得したエッジの情報は、json.dumps関数を使って文字列に変換しています。(44行目)

[ブラウザで表示]

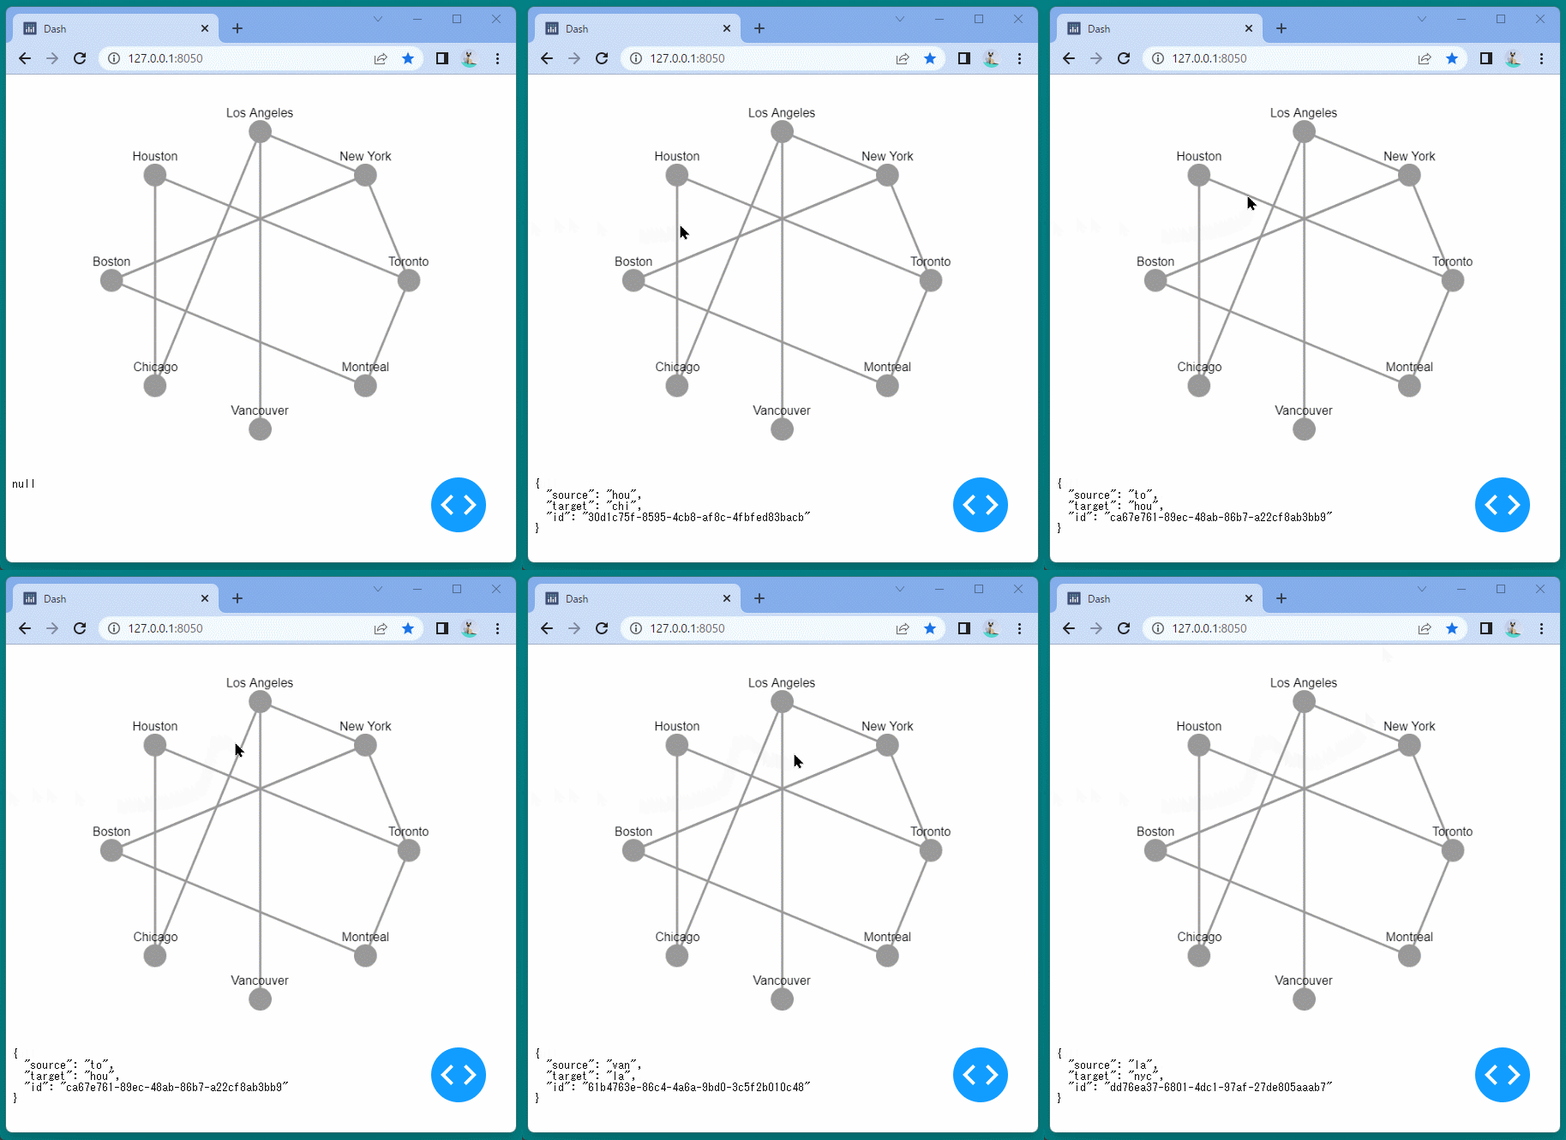
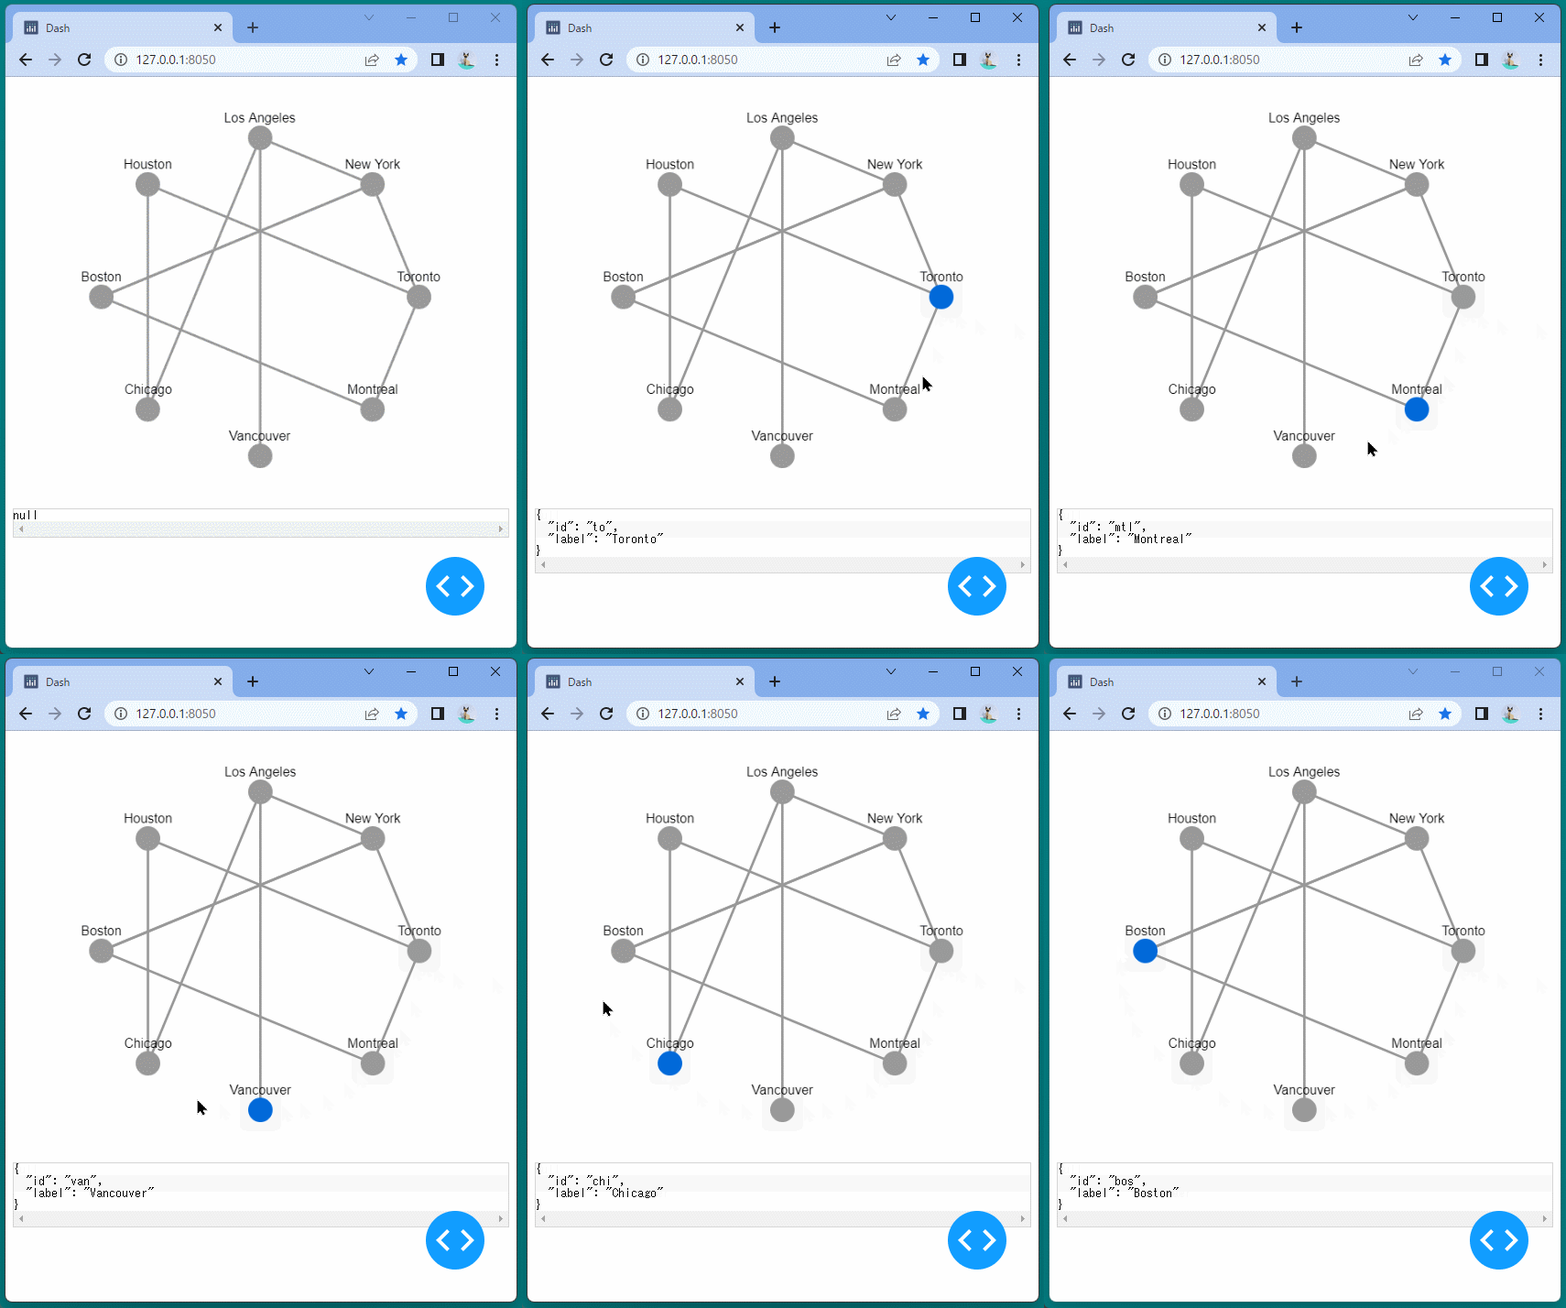
カーソルを移動してエッジに合わせると、そのエッジの情報がブラウザ下部に表示されることを確認できます。

Dash Cytoscape⑲(イベントコールバック/mouseoverNodeData)

イベントコールバック/mouseoverNodeData

mouseoverNodeDataを使うと、カーソルをのせたノードのデータ辞書を取得することができます。

コールバック関数の入力(Input)にmouseoverNodeDataを指定します。(41行目)

[ソースコード]

1
2
3
4
5
6
7
8
9
10
11
12
13
14
15
16
17
18
19
20
21
22
23
24
25
26
27
28
29
30
31
32
33
34
35
36
37
38
39
40
41
42
43
44
45
46
47
import json

import dash
import dash_cytoscape as cyto
import dash_html_components as html
import dash_core_components as dcc
from dash.dependencies import Input, Output

app = dash.Dash(__name__)

nodes = [
{'data': {'id': short, 'label': label} }
for short, label in (
('la', 'Los Angeles'), ('nyc', 'New York'), ('to', 'Toronto'),
('mtl', 'Montreal'), ('van', 'Vancouver'), ('chi', 'Chicago'),
('bos', 'Boston'), ('hou', 'Houston')
)
]

edges = [
{'data': {'source': source, 'target': target}}
for source, target in (
('van', 'la'), ('la', 'chi'), ('hou', 'chi'),
('to', 'mtl'), ('mtl', 'bos'), ('nyc', 'bos'),
('to', 'hou'), ('to', 'nyc'), ('la', 'nyc'),
('nyc', 'bos')
)
]

app.layout = html.Div([
cyto.Cytoscape(
id='cytoscape-event',
layout={'name': 'circle'},
elements=edges+nodes,
style={'width': '100%', 'height': '450px'}
),
html.Pre(id='show_json')
])

@app.callback(Output('show_json', 'children'),
Input('cytoscape-event', 'mouseoverNodeData'))
def displayData(data):
if data:
return "You hovered over the city: " + data['label']

if __name__ == '__main__':
app.run_server(debug=True)

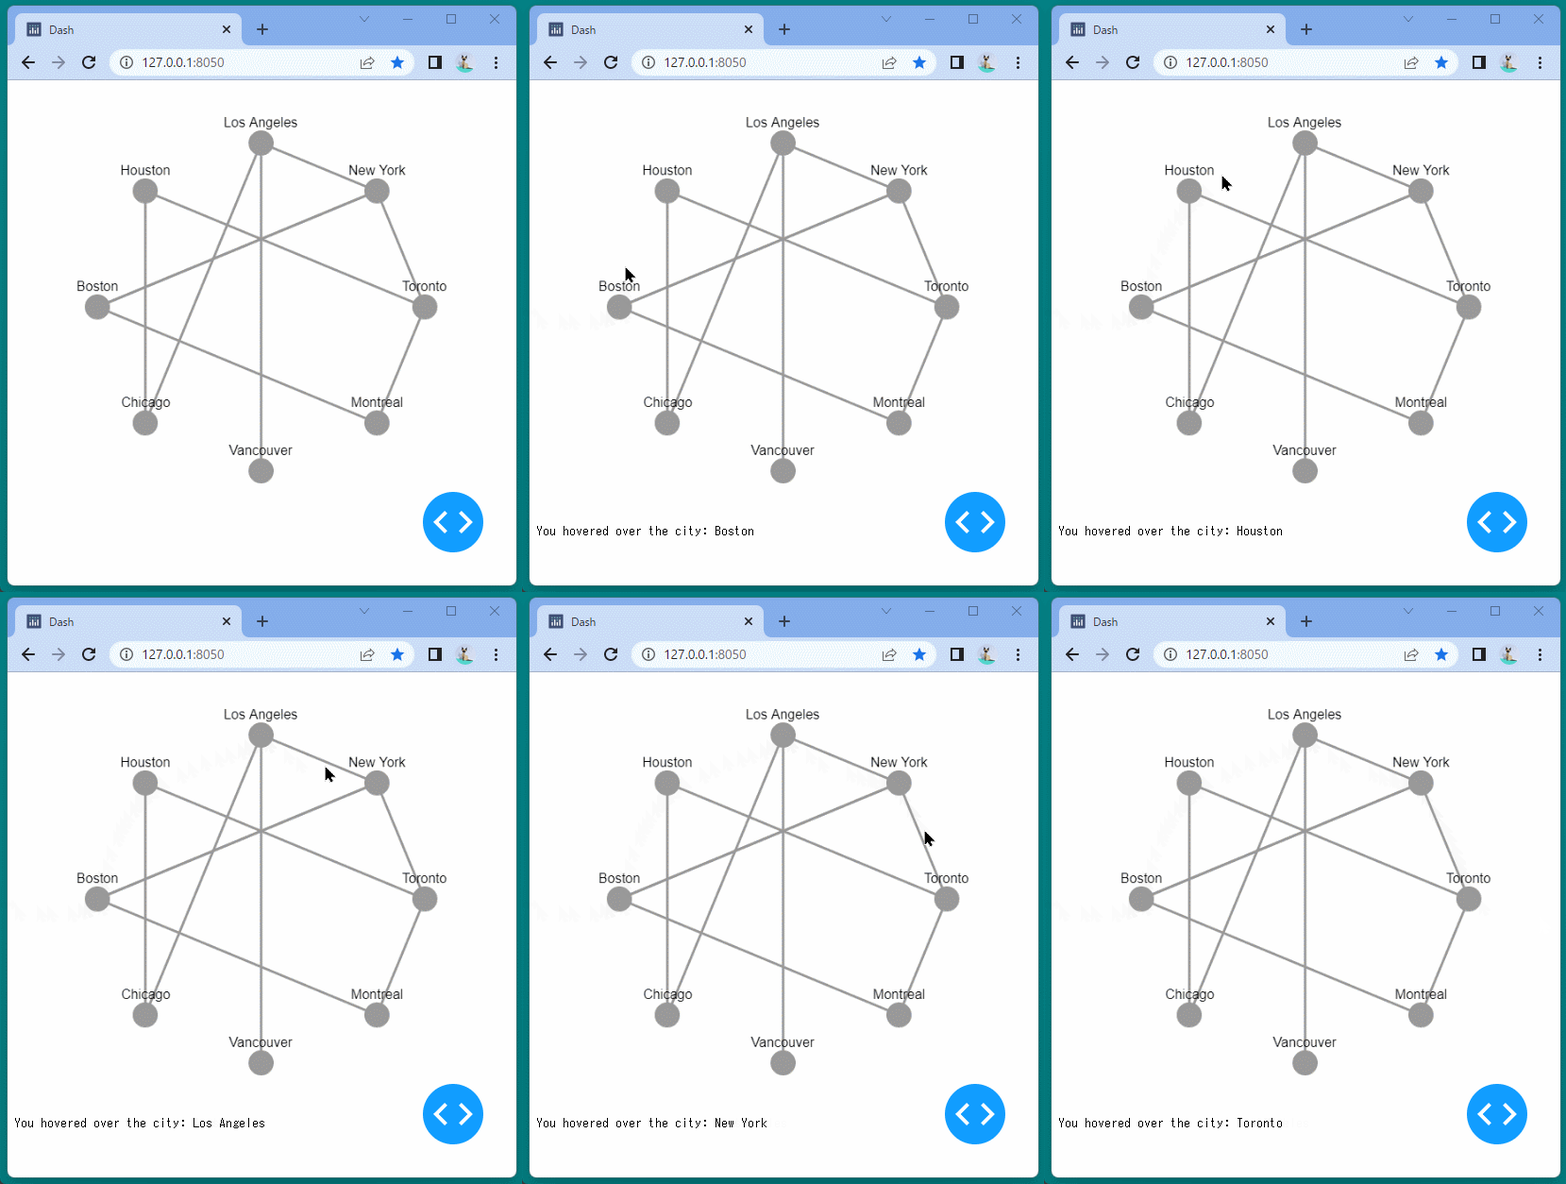
上記ソースでは、カーソルをのせたノードのラベルを表示しています。

[ブラウザで表示]

カーソルを移動してノードに合わせると、そのノードのラベルがブラウザ下部に表示されることを確認できます。

Dash Cytoscape⑱(イベントコールバック/tapEdgeData)

イベントコールバック/tapEdgeData

tapEdgeDataを使って、クリックしたエッジのデータ辞書を取得します。

コールバック関数の入力(Input)にtapEdgeDataを指定しています。(62行目)

[ソースコード]

1
2
3
4
5
6
7
8
9
10
11
12
13
14
15
16
17
18
19
20
21
22
23
24
25
26
27
28
29
30
31
32
33
34
35
36
37
38
39
40
41
42
43
44
45
46
47
48
49
50
51
52
53
54
55
56
57
58
59
60
61
62
63
64
65
66
67
import json

import dash
import dash_cytoscape as cyto
import dash_html_components as html
import dash_core_components as dcc
from dash.dependencies import Input, Output

app = dash.Dash(__name__)

styles = {
'pre': {
'border': 'thin lightgrey solid',
'overflowX': 'scroll'
}
}

nodes = [
{
'data': {'id': short, 'label': label},
'position': {'x': 20*lat, 'y': -20*long}
}
for short, label, long, lat in (
('la', 'Los Angeles', 34.03, -118.25),
('nyc', 'New York', 40.71, -74),
('to', 'Toronto', 43.65, -79.38),
('mtl', 'Montreal', 45.50, -73.57),
('van', 'Vancouver', 49.28, -123.12),
('chi', 'Chicago', 41.88, -87.63),
('bos', 'Boston', 42.36, -71.06),
('hou', 'Houston', 29.76, -95.37)
)
]

edges = [
{'data': {'source': source, 'target': target}}
for source, target in (
('van', 'la'),
('la', 'chi'),
('hou', 'chi'),
('to', 'mtl'),
('mtl', 'bos'),
('nyc', 'bos'),
('to', 'hou'),
('to', 'nyc'),
('la', 'nyc'),
('nyc', 'bos')
)
]

app.layout = html.Div([
cyto.Cytoscape(
id='cytoscape-event-callbacks-1',
layout={'name': 'circle'},
elements=edges+nodes,
style={'width': '100%', 'height': '450px'}
),
html.Pre(id='cytoscape-tapEdgeData-json', style=styles['pre'])
])

@app.callback(Output('cytoscape-tapEdgeData-json', 'children'),
Input('cytoscape-event-callbacks-1', 'tapEdgeData'))
def displayTapEdgeData(data):
return json.dumps(data, indent=2)

if __name__ == '__main__':
app.run_server(debug=True)

取得したエッジ情報は、json.dumps関数を使って文字列に変換しています。(64行目)

[ブラウザで表示]

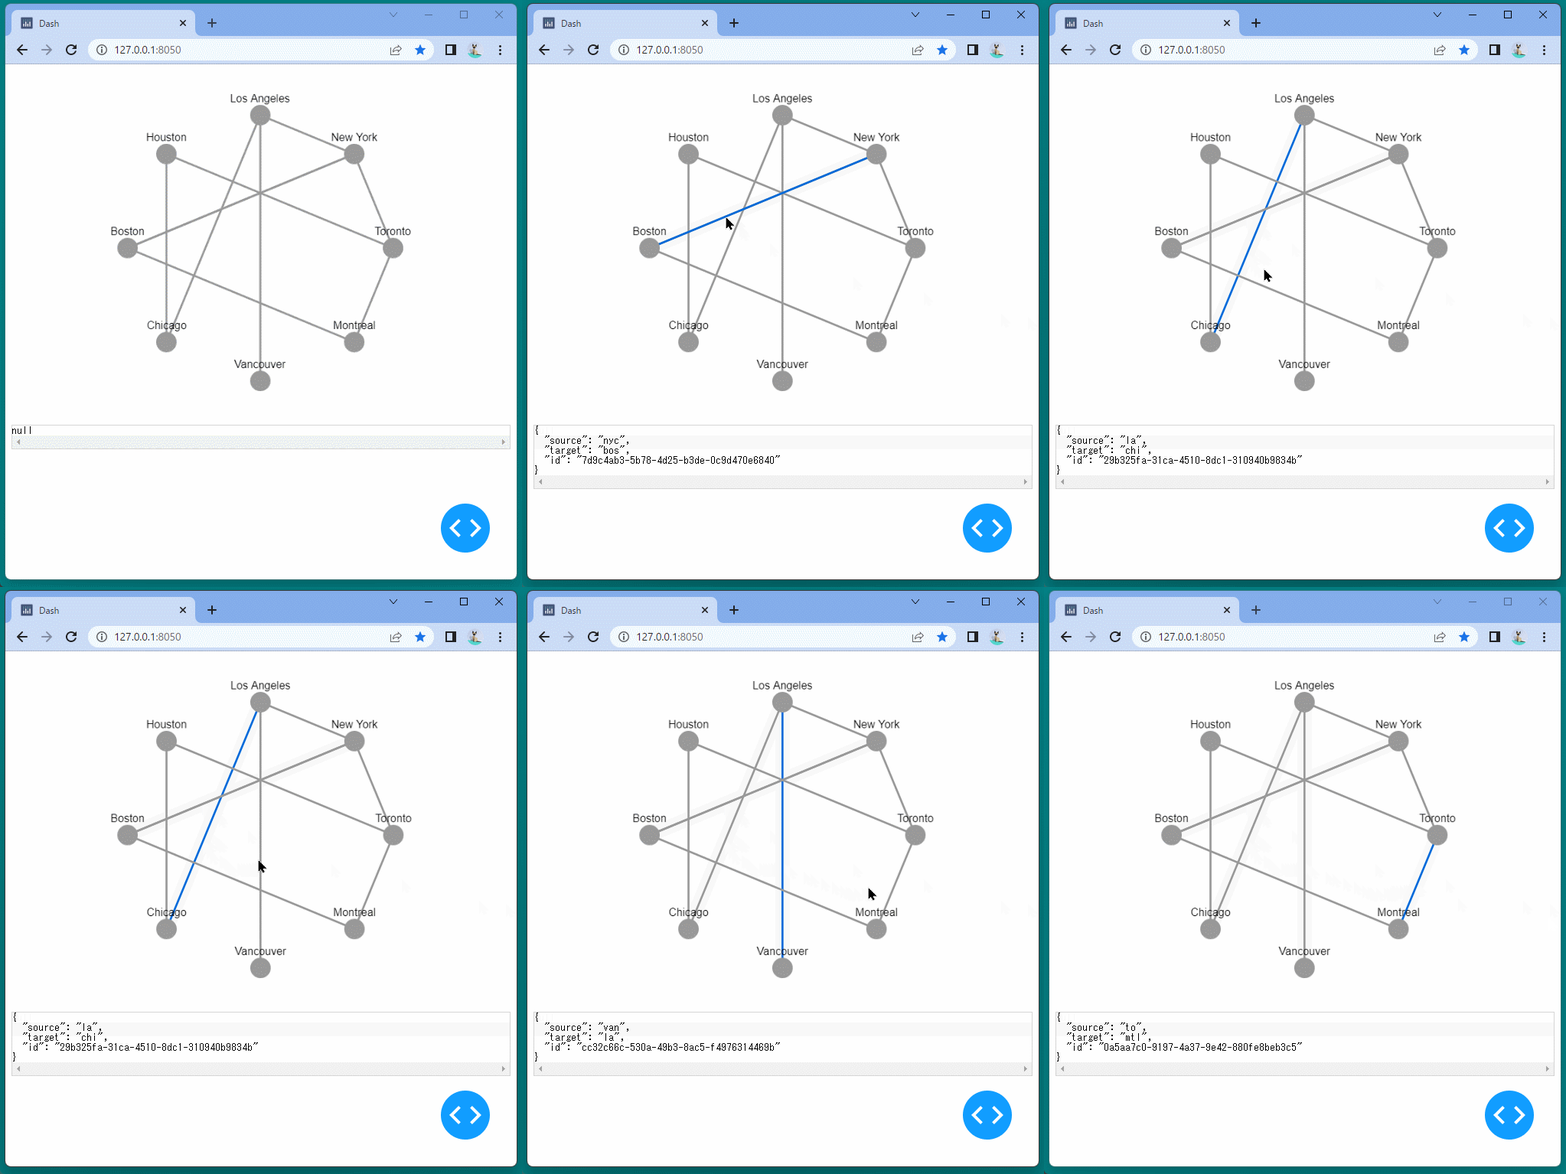
エッジをクリックするとそのエッジの情報がブラウザ下部に表示されることを確認できます。

Dash Cytoscape⑰(イベントコールバック/tapNodeData)

イベントコールバック/tapNodeData

tapNodeDataを使って、クリックしたノードのデータ辞書を取得します。

コールバック関数の入力(Input)にtapNodeDataを指定しています。(63行目)

[ソースコード]

1
2
3
4
5
6
7
8
9
10
11
12
13
14
15
16
17
18
19
20
21
22
23
24
25
26
27
28
29
30
31
32
33
34
35
36
37
38
39
40
41
42
43
44
45
46
47
48
49
50
51
52
53
54
55
56
57
58
59
60
61
62
63
64
65
66
67
68
import json

import dash
import dash_cytoscape as cyto
import dash_html_components as html
import dash_core_components as dcc
from dash.dependencies import Input, Output

app = dash.Dash(__name__)

styles = {
'pre': {
'border': 'thin lightgrey solid',
'overflowX': 'scroll'
}
}

nodes = [
{
'data': {'id': short, 'label': label},
'position': {'x': 20*lat, 'y': -20*long}
}
for short, label, long, lat in (
('la', 'Los Angeles', 34.03, -118.25),
('nyc', 'New York', 40.71, -74),
('to', 'Toronto', 43.65, -79.38),
('mtl', 'Montreal', 45.50, -73.57),
('van', 'Vancouver', 49.28, -123.12),
('chi', 'Chicago', 41.88, -87.63),
('bos', 'Boston', 42.36, -71.06),
('hou', 'Houston', 29.76, -95.37)
)
]

edges = [
{'data': {'source': source, 'target': target}}
for source, target in (
('van', 'la'),
('la', 'chi'),
('hou', 'chi'),
('to', 'mtl'),
('mtl', 'bos'),
('nyc', 'bos'),
('to', 'hou'),
('to', 'nyc'),
('la', 'nyc'),
('nyc', 'bos')
)
]

app.layout = html.Div([
cyto.Cytoscape(
id='cytoscape-event-callbacks-1',
layout={'name': 'circle'},
elements=edges+nodes,
style={'width': '100%', 'height': '450px'}
),
html.Pre(id='cytoscape-tapNodeData-json', style=styles['pre'])
])


@app.callback(Output('cytoscape-tapNodeData-json', 'children'),
Input('cytoscape-event-callbacks-1', 'tapNodeData'))
def displayTapNodeData(data):
return json.dumps(data, indent=2)

if __name__ == '__main__':
app.run_server(debug=True)

取得したノード情報は、json.dumps関数を使って文字列に変換しています。(65行目)

[ブラウザで表示]

ノードをクリックするとそのノードの情報がブラウザ下部に表示されることを確認できます。

Dash Cytoscape⑯(イベントコールバック)

イベントコールバックとは

ノードやエッジなどDash Cytoscapeコンポーネントに対する操作をトリガーに、ネットワーク図やほかのコンポーネントを変化させることができます。

このようなコールバックのことをイベントコールバックと呼びます。

イベントコールバック一覧

イベントコールバックを一覧にまとめます。

イベント 内容
tapNode クリックしたノードの要素辞書全体を取得する。
tapNodeData クリックしたノードのデータ辞書を取得する。
tapEdge クリックしたエッジの要素辞書全体を取得する。
tapEgdeData クリックしたエッジのデータ辞書を取得する。
mouseoverNodeData マウスオーバーしたノードのデータ辞書を取得する。
mouseoverEdgeData マウスオーバーしたエッジのデータ辞書を取得する。
selectedNodeData 選択したノードのデータ辞書を取得する。
selectedEdgeData 選択したエッジのデータ辞書を取得する。

次回からはイベントコールバックを使ったサンプルを実行していきます。

Dash Cytoscape⑮(コールバック/ノードの追加と削除)

コールバック2

今回はコールバックを使って、ノードの追加削除を行います。

[ソースコード]

1
2
3
4
5
6
7
8
9
10
11
12
13
14
15
16
17
18
19
20
21
22
23
24
25
26
27
28
29
30
31
32
33
34
35
36
37
38
39
40
41
42
43
44
45
46
47
48
49
50
51
52
53
54
55
56
57
58
59
60
61
62
63
64
65
66
67
68
69
70
71
72
73
74
75
76
77
78
79
80
81
82
83
84
85
86
87
88
89
90
91
92
93
94
95
96
97
98
99
100
101
102
103
104
105
106
107
108
109
110
111
112
113
114
115
116
117
118
119
120
121
122
123
124
125
126
127
128
129
130
131
import dash
import dash_cytoscape as cyto
import dash_html_components as html
import dash_core_components as dcc
from pprint import pprint
from dash.dependencies import Input, Output, State

app = dash.Dash(__name__)

nodes = [
{
'data': {'id': short, 'label': label},
'position': {'x': 20*lat, 'y': -20*long}
}
for short, label, long, lat in (
('la', 'Los Angeles', 34.03, -118.25),
('nyc', 'New York', 40.71, -74),
('to', 'Toronto', 43.65, -79.38),
('mtl', 'Montreal', 45.50, -73.57),
('van', 'Vancouver', 49.28, -123.12),
('chi', 'Chicago', 41.88, -87.63),
('bos', 'Boston', 42.36, -71.06),
('hou', 'Houston', 29.76, -95.37)
)
]

edges = [
{'data': {'source': source, 'target': target}}
for source, target in (
('van', 'la'),
('la', 'chi'),
('hou', 'chi'),
('to', 'mtl'),
('mtl', 'bos'),
('nyc', 'bos'),
('to', 'hou'),
('to', 'nyc'),
('la', 'nyc'),
('nyc', 'bos')
)
]

default_stylesheet = [
{
'selector': 'node',
'style': {
'background-color': '#BFD7B5',
'label': 'data(label)'
}
},
{
'selector': 'edge',
'style': {
'line-color': '#A3C4BC'
}
}
]

app.layout = html.Div([
html.Div([
html.Button('Add Node', id='btn-add-node', n_clicks_timestamp=0),
html.Button('Remove Node', id='btn-remove-node', n_clicks_timestamp=0)
]),

cyto.Cytoscape(
id='cytoscape-elements-callbacks',
layout={'name': 'cose'},
stylesheet=default_stylesheet,
style={'width': '100%', 'height': '450px'},
elements=edges+nodes
)
])

@app.callback(Output('cytoscape-elements-callbacks', 'elements'),
Input('btn-add-node', 'n_clicks_timestamp'),
Input('btn-remove-node', 'n_clicks_timestamp'),
State('cytoscape-elements-callbacks', 'elements'))
def update_elements(btn_add, btn_remove, elements):
current_nodes, deleted_nodes = get_current_and_deleted_nodes(elements)
# If the add button was clicked most recently and there are nodes to add
if int(btn_add) > int(btn_remove) and len(deleted_nodes):

# We pop one node from deleted nodes and append it to nodes list.
current_nodes.append(deleted_nodes.pop())
# Get valid edges -- both source and target nodes are in the current graph
cy_edges = get_current_valid_edges(current_nodes, edges)
return cy_edges + current_nodes

# If the remove button was clicked most recently and there are nodes to remove
elif int(btn_remove) > int(btn_add) and len(current_nodes):
current_nodes.pop()
cy_edges = get_current_valid_edges(current_nodes, edges)
return cy_edges + current_nodes

# Neither have been clicked yet (or fallback condition)
return elements

def get_current_valid_edges(current_nodes, all_edges):
"""Returns edges that are present in Cytoscape:
its source and target nodes are still present in the graph.
"""
valid_edges = []
node_ids = {n['data']['id'] for n in current_nodes}

for e in all_edges:
if e['data']['source'] in node_ids and e['data']['target'] in node_ids:
valid_edges.append(e)
return valid_edges

def get_current_and_deleted_nodes(elements):
"""Returns nodes that are present in Cytoscape and the deleted nodes
"""
current_nodes = []
deleted_nodes = []

# get current graph nodes
for ele in elements:
# if the element is a node
if 'source' not in ele['data']:
current_nodes.append(ele)

# get deleted nodes
node_ids = {n['data']['id'] for n in current_nodes}
for n in nodes:
if n['data']['id'] not in node_ids:
deleted_nodes.append(n)

return current_nodes, deleted_nodes

if __name__ == '__main__':
app.run_server(debug=True)

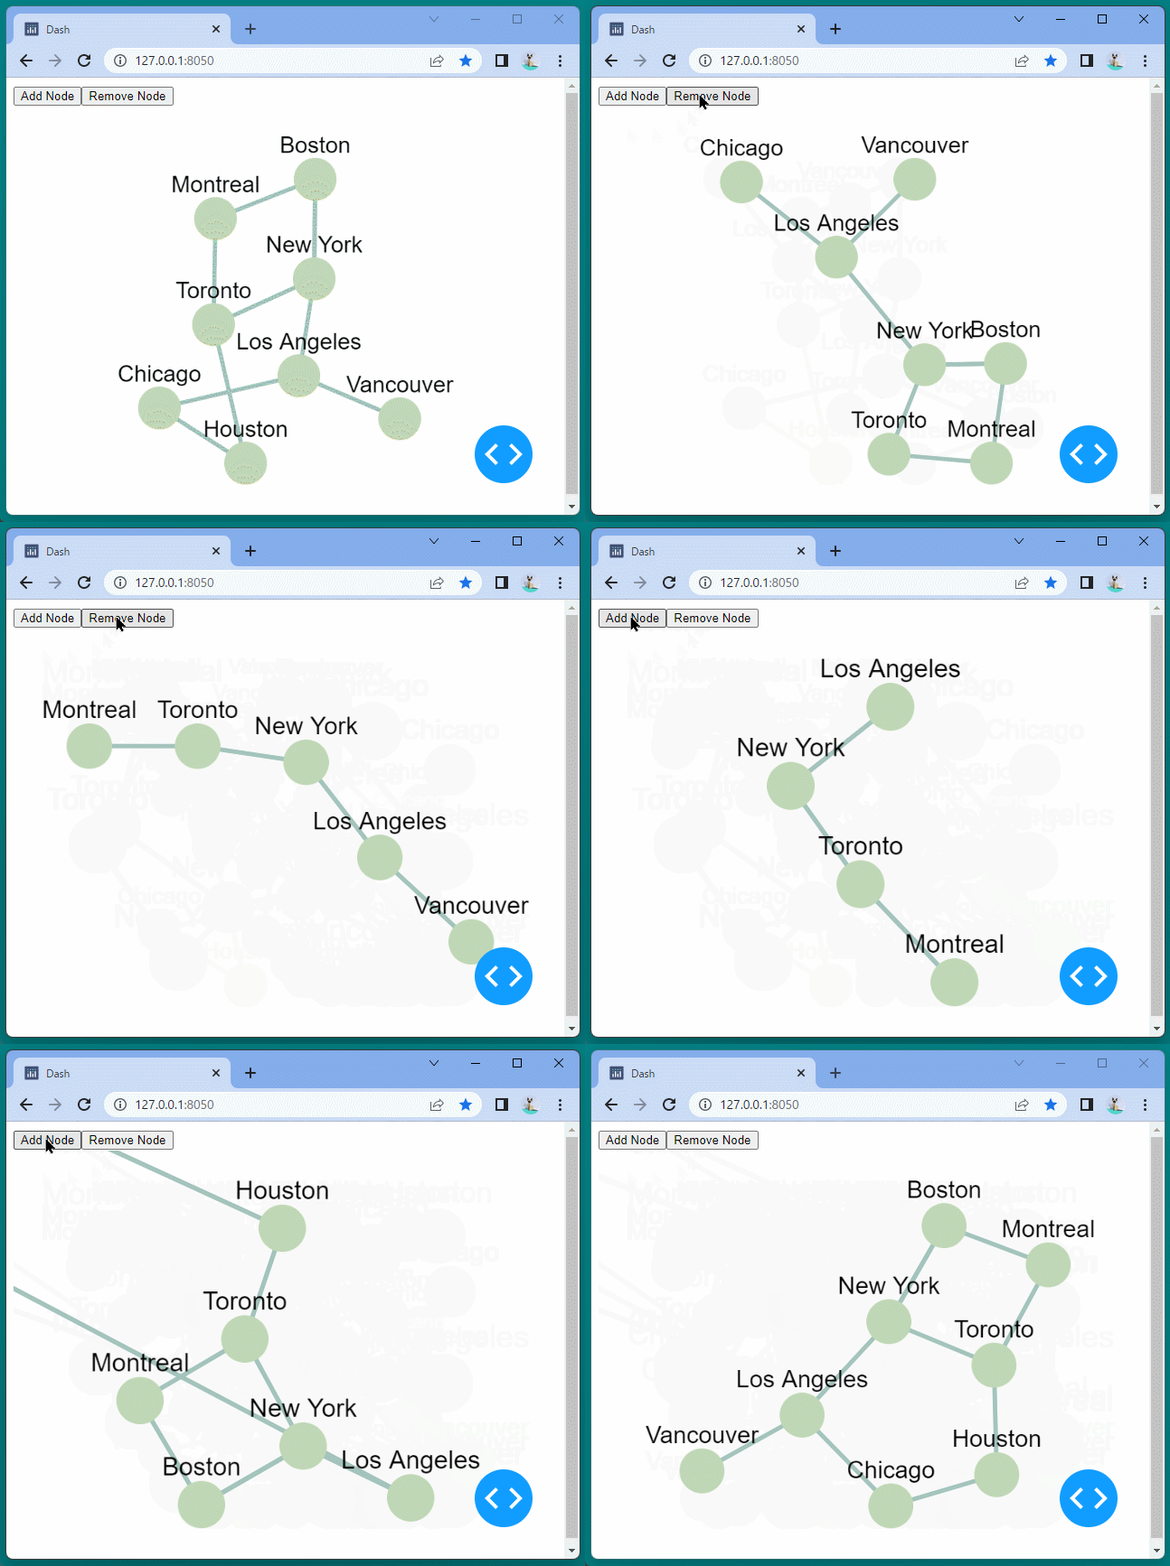
コールバック関数(update_elements)では、現在表示されているノード(current_nodes)と削除済みのノード(deleted_nodes)を管理しています。

追加ボタンがクリックされた場合は、削除済みノードの1つを表示ノードにし、エッジ(ノードとノードを結ぶ線)も合わせて表示します。

削除ボタンがクリックされた場合は、表示ノードの1つを削除済みノードとして、エッジと合わせて非表示にします。

[ブラウザで表示]

Add Nodeボタンを押すとノードが追加され、Remove Nodeボタンを押すとノードが削除されることを確認できます。

Dash Cytoscape⑭(コールバック/レイアウト変更)

コールバック

コールバックを使うと、ユーザ操作をトリガーにしてDash Cytoscapeのコンポーネントを変化させることができます。

コールバックを作成する手順は次の通りです。

  1. デコレータを使って、コールバック関数を定義します。
  2. 入力項目(どのコンポーネントのどの値を受け取るか)を、Inputクラスを使って宣言します。
    この入力項目の値が、コールバック関数の引数として渡されます。
  3. 出力項目(どのコンポーネントのどの値を変化させるか)を、Outputクラスを使って宣言します。
    この出力項目に対し、コールバック関数の返り値が渡されます。

ドロップダウンリストで、ノードのレイアウトを変更することができるサンプルソースは下記の通りです。

[ソースコード]

1
2
3
4
5
6
7
8
9
10
11
12
13
14
15
16
17
18
19
20
21
22
23
24
25
26
27
28
29
30
31
32
33
34
35
36
37
38
39
40
41
42
43
44
45
46
47
48
49
50
51
52
53
54
55
56
57
58
59
60
61
62
63
64
65
66
67
68
69
70
71
import dash
import dash_cytoscape as cyto
import dash_html_components as html
import dash_core_components as dcc
from dash.dependencies import Input, Output

app = dash.Dash(__name__)

nodes = [
{
'data': {'id': short, 'label': label},
'position': {'x': 20*lat, 'y': -20*long}
}
for short, label, long, lat in (
('la', 'Los Angeles', 34.03, -118.25),
('nyc', 'New York', 40.71, -74),
('to', 'Toronto', 43.65, -79.38),
('mtl', 'Montreal', 45.50, -73.57),
('van', 'Vancouver', 49.28, -123.12),
('chi', 'Chicago', 41.88, -87.63),
('bos', 'Boston', 42.36, -71.06),
('hou', 'Houston', 29.76, -95.37)
)
]

edges = [
{'data': {'source': source, 'target': target}}
for source, target in (
('van', 'la'),
('la', 'chi'),
('hou', 'chi'),
('to', 'mtl'),
('mtl', 'bos'),
('nyc', 'bos'),
('to', 'hou'),
('to', 'nyc'),
('la', 'nyc'),
('nyc', 'bos')
)
]

elements = nodes + edges

app.layout = html.Div([
dcc.Dropdown(
id='dropdown-update-layout',
value='grid',
clearable=False,
options=[
{'label': name.capitalize(), 'value': name}
for name in ['grid', 'random', 'circle', 'cose', 'concentric']
]
),
cyto.Cytoscape(
id='cytoscape-update-layout',
layout={'name': 'grid'},
style={'width': '100%', 'height': '450px'},
elements=elements
)
])

@app.callback(Output('cytoscape-update-layout', 'layout'),
Input('dropdown-update-layout', 'value'))
def update_layout(layout):
return {
'name': layout,
'animate': True
}

if __name__ == '__main__':
app.run_server(debug=True)

コルバック関数は 62~68行目 で定義しています。

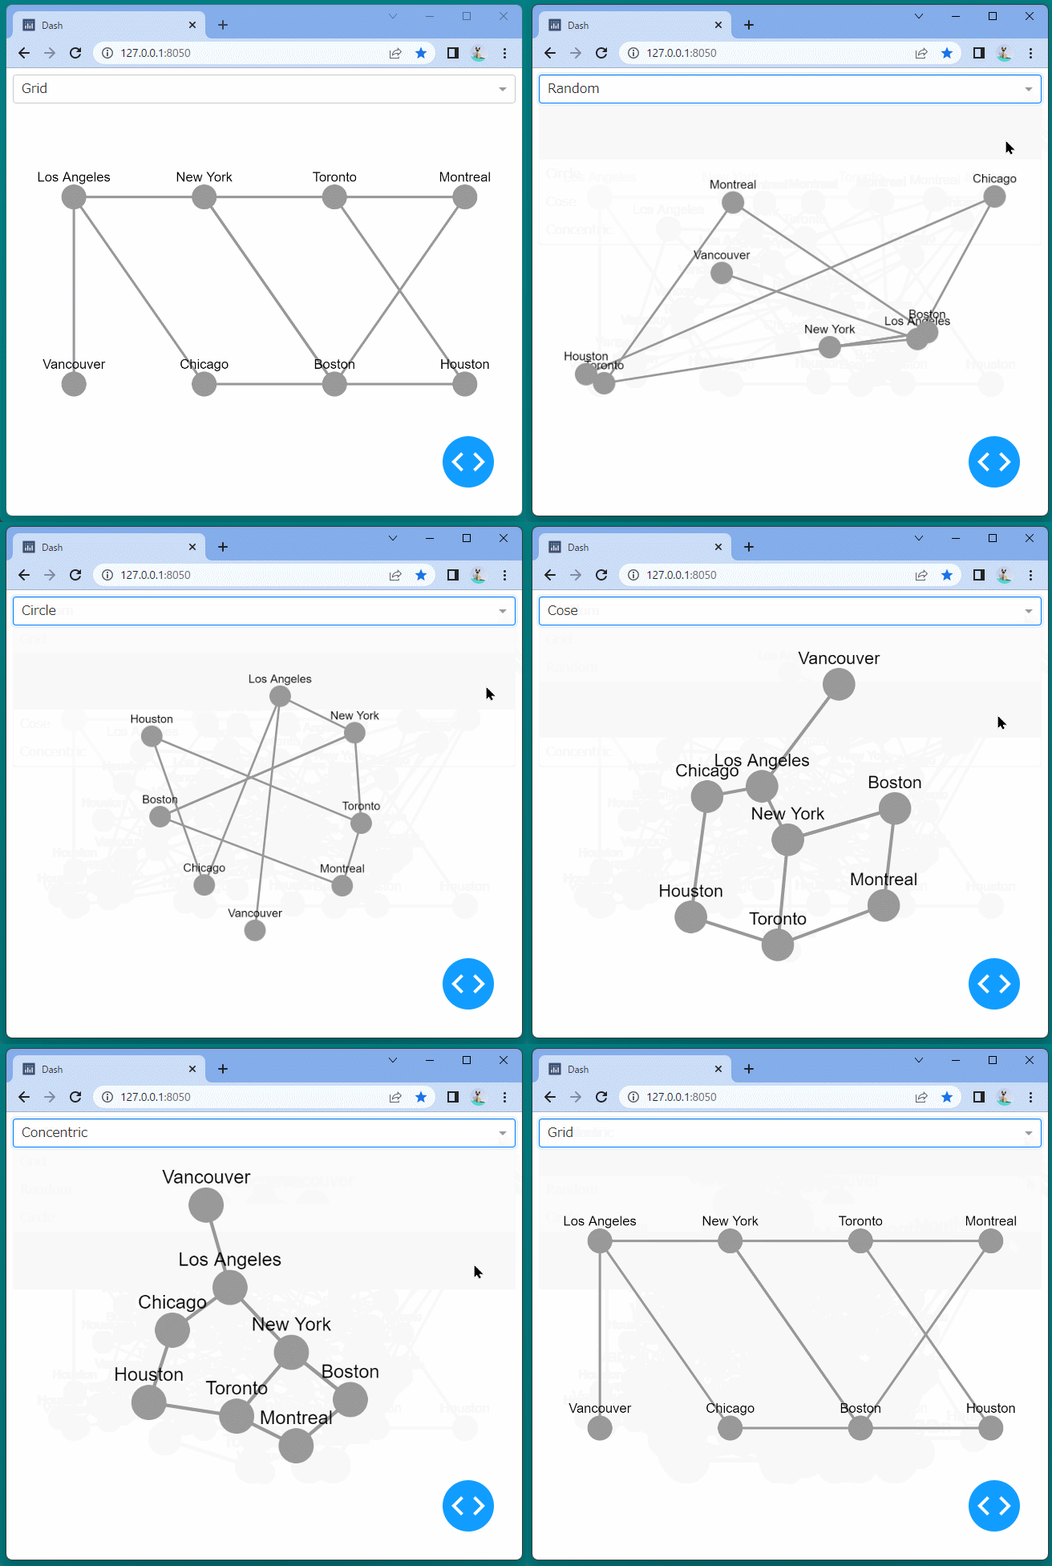
ドロップダウンリストの値を入力として、その入力値をノードのレイアウトとして設定しています。

[ブラウザで表示]

ブラウザ上部にドロップダウンリストが表示され、レイアウトを選択するとノードの配置が変更されます。

Dash Cytoscape⑬(ノードの配置方法 / random)

ランダム(random)

レイアウト辞書の“name”キー“random”を指定すると、ノードをランダムに配置することができます。(50行目)

[ソースコード]

1
2
3
4
5
6
7
8
9
10
11
12
13
14
15
16
17
18
19
20
21
22
23
24
25
26
27
28
29
30
31
32
33
34
35
36
37
38
39
40
41
42
43
44
45
46
47
48
49
50
51
52
53
54
55
56
import dash
import math

import dash_cytoscape as cyto
import dash_html_components as html

app = dash.Dash(__name__)

nodes = [
{
'data': {'id': short, 'label': label},
'position': {'x': 20 * lat, 'y': -20 * long}
}
for short, label, long, lat in (
('la', 'Los Angeles', 34.03, -118.25),
('nyc', 'New York', 40.71, -74),
('to', 'Toronto', 43.65, -79.38),
('mtl', 'Montreal', 45.50, -73.57),
('van', 'Vancouver', 49.28, -123.12),
('chi', 'Chicago', 41.88, -87.63),
('bos', 'Boston', 42.36, -71.06),
('hou', 'Houston', 29.76, -95.37)
)
]

edges = [
{'data': {'source': source, 'target': target}}
for source, target in (
('van', 'la'),
('la', 'chi'),
('hou', 'chi'),
('to', 'mtl'),
('mtl', 'bos'),
('nyc', 'bos'),
('to', 'hou'),
('to', 'nyc'),
('la', 'nyc'),
('nyc', 'bos')
)
]

elements = nodes + edges

app.layout = html.Div([
cyto.Cytoscape(
id='cytoscape-layout-9',
elements=elements,
style={'width': '100%', 'height': '350px'},
layout={
'name': 'random'
}
)
])

if __name__ == '__main__':
app.run_server(debug=True)

[ブラウザで表示]

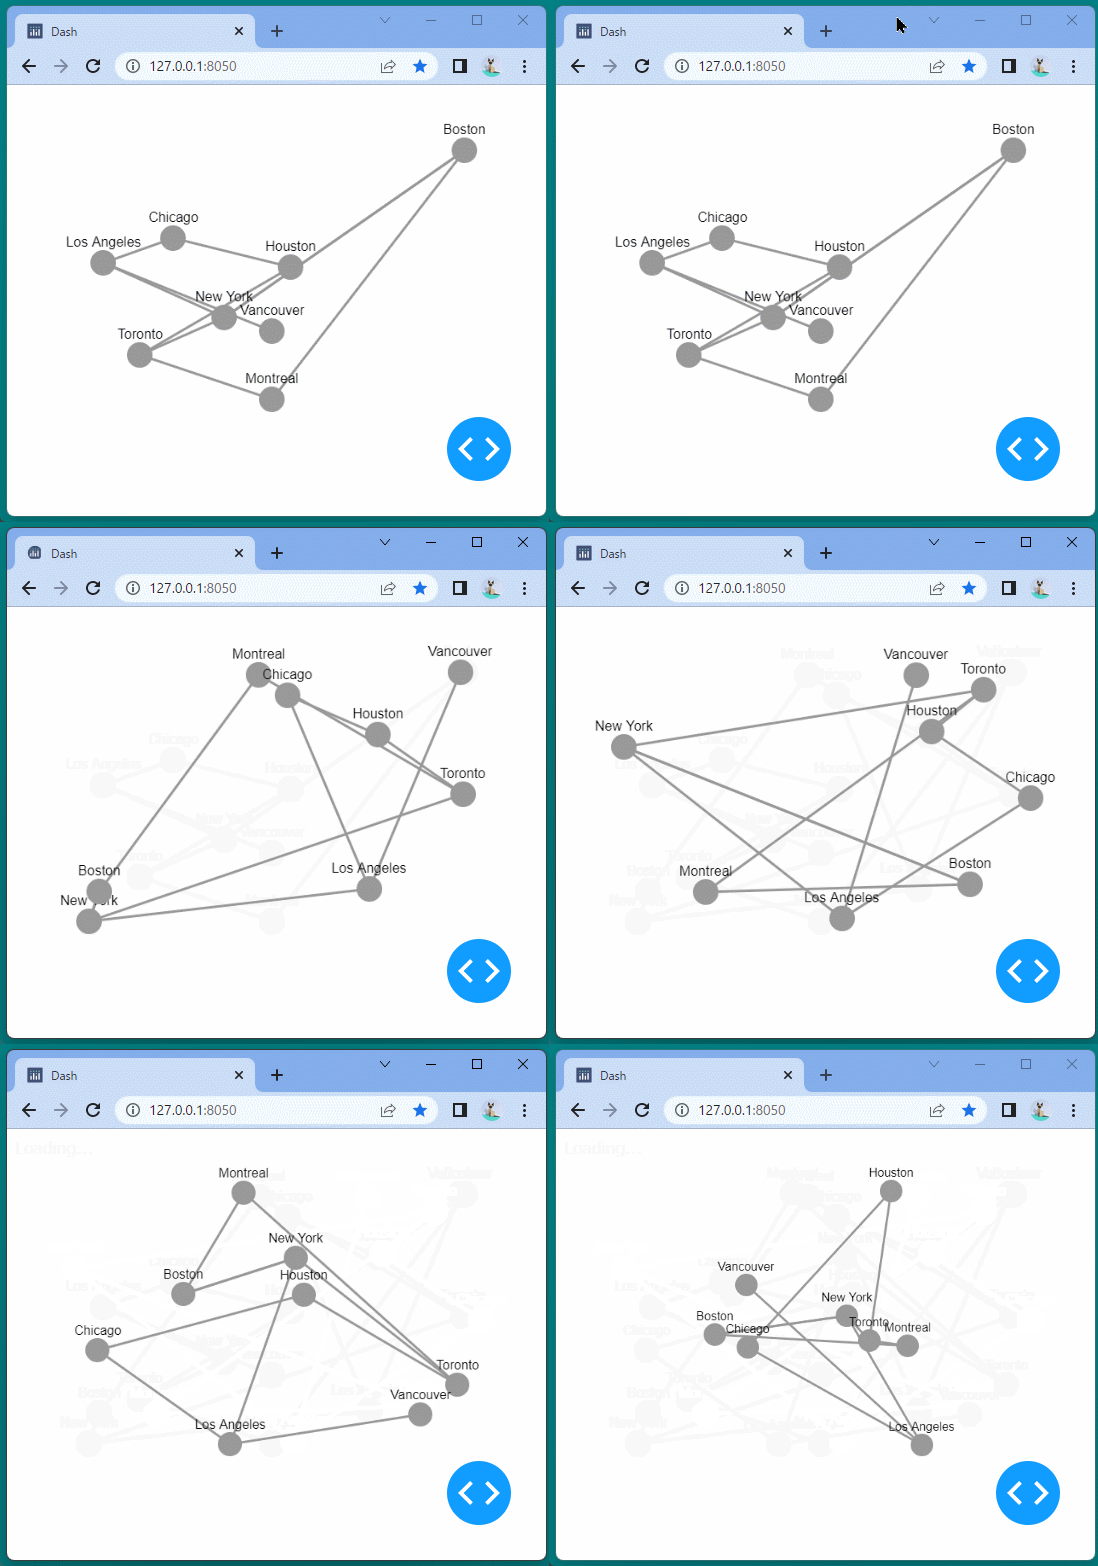
リロードするたびにノードがランダムに配置されることを確認できます。

Dash Cytoscape⑫(ノードの配置方法 / cose)

物理シミュレーション(cose)

レイアウト辞書の“name”キー“cose”を指定すると、物理シミュレーションに基づく方法でノードを自動配置することができます。(50行目)

[ソースコード]

1
2
3
4
5
6
7
8
9
10
11
12
13
14
15
16
17
18
19
20
21
22
23
24
25
26
27
28
29
30
31
32
33
34
35
36
37
38
39
40
41
42
43
44
45
46
47
48
49
50
51
52
53
54
55
56
57
import dash
import math

import dash_cytoscape as cyto
import dash_html_components as html

app = dash.Dash(__name__)

nodes = [
{
'data': {'id': short, 'label': label},
'position': {'x': 20 * lat, 'y': -20 * long}
}
for short, label, long, lat in (
('la', 'Los Angeles', 34.03, -118.25),
('nyc', 'New York', 40.71, -74),
('to', 'Toronto', 43.65, -79.38),
('mtl', 'Montreal', 45.50, -73.57),
('van', 'Vancouver', 49.28, -123.12),
('chi', 'Chicago', 41.88, -87.63),
('bos', 'Boston', 42.36, -71.06),
('hou', 'Houston', 29.76, -95.37)
)
]

edges = [
{'data': {'source': source, 'target': target}}
for source, target in (
('van', 'la'),
('la', 'chi'),
('hou', 'chi'),
('to', 'mtl'),
('mtl', 'bos'),
('nyc', 'bos'),
('to', 'hou'),
('to', 'nyc'),
('la', 'nyc'),
('nyc', 'bos')
)
]

elements = nodes + edges

app.layout = html.Div([
cyto.Cytoscape(
id='cytoscape-layout-9',
elements=elements,
style={'width': '100%', 'height': '350px'},
layout={
'name': 'cose'
# ,'gravity':100 # オプション
}
)
])

if __name__ == '__main__':
app.run_server(debug=True)

[ブラウザで表示(gravity=1の場合)]

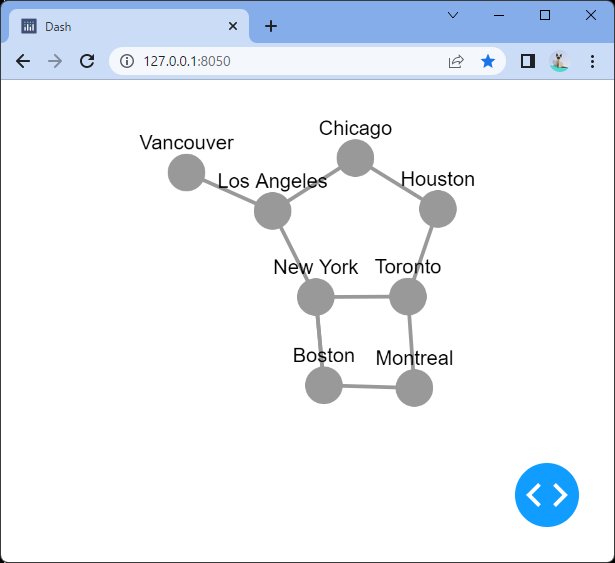
物理シミュレーションに基づいて、ノードが自動的に配置されました。

オプションとして“gravity”キー(デフォルトは 1 )を設定すると、物理シミュレーション時の重力の強さを指定できます。

“gravity”キー100を指定してみます。(上記ソースの51行目をコメントアウト)

[ブラウザで表示(gravity=100の場合)]

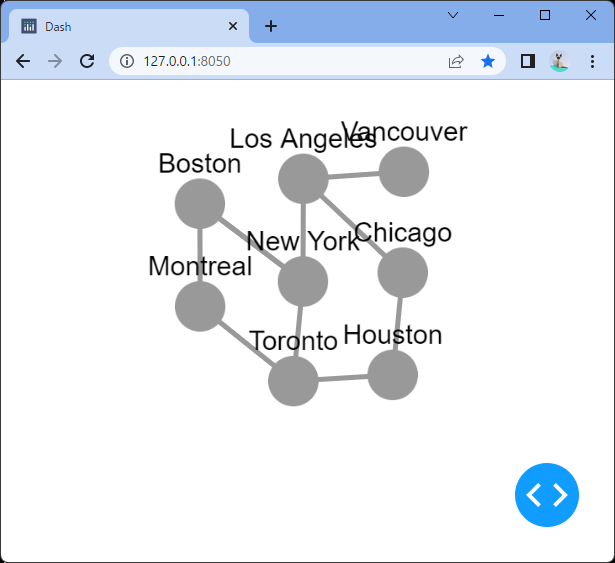
デフォルト(“gravity”=1)よりもノードが密に配置されていることが確認できます。