Security patching is one of the most critical — and most disruptive — aspects of system administration. Patch too aggressively and you risk unplanned downtime. Patch too conservatively and you leave systems vulnerable. The sweet spot lies in intelligent scheduling.
In this post, we’ll model the problem formally, solve it with Python using optimization techniques, and visualize the results in both 2D and 3D.
🔐 Problem Statement
Suppose you manage 10 servers, each running different services. Every server has:
- A vulnerability severity score (how urgently it needs patching)
- A current load profile across 24 hours (when it’s busy)
- A patch duration (how long the patch window takes)
- A maintenance window constraint (certain hours are forbidden)
Our goal:
Schedule each server’s patch window to minimize total weighted downtime impact, while respecting time constraints and avoiding peak load hours.
📐 Mathematical Formulation
Let:
- $N$ = number of servers
- $t_i$ = patch start time for server $i$ (decision variable, integer hour 0–23)
- $d_i$ = patch duration for server $i$ (hours)
- $L_i(t)$ = load of server $i$ at hour $t$ (0.0–1.0)
- $s_i$ = severity score of server $i$ (higher = more urgent)
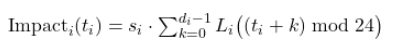
Downtime Impact for server $i$:
Objective — minimize total weighted impact:
$$\min_{t_1, \ldots, t_N} \sum_{i=1}^{N} \text{Impact}_i(t_i)$$
Subject to:
$$t_i \notin \text{ForbiddenHours}_i \quad \forall i$$
$$t_i \in {0, 1, \ldots, 23} \quad \forall i$$
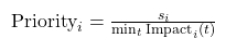
Urgency-Weighted Score (used to prioritize scheduling order):
🐍 Python Solution
1 | # ============================================================ |
🔍 Code Walkthrough
1. Load Profile Generation — generate_load_profile()
Each server type gets a realistic load curve shaped by Gaussian or sinusoidal functions:
- Web / API / CDN / Auth — bell-curve peak around 13:00 (business hours)
- DB / Storage — sustained high load from 08:00–20:00
- ML-Worker / Backup — overnight batch jobs, peaking around 03:00
- Cache — mirrors web traffic with slight lag
- Log-Agg — moderate, sinusoidally oscillating
Small Gaussian noise ($\sigma = 0.03$) keeps profiles realistic.
2. Impact Matrix — build_impact_matrix()
$$\text{Matrix}[i][h] = \begin{cases} s_i \cdot \sum_{k=0}^{d_i-1} L_i\bigl((h+k) \bmod 24\bigr) & h \notin \text{Forbidden}_i \ +\infty & \text{otherwise} \end{cases}$$
Computing this once upfront as an $N \times 24$ matrix avoids redundant recalculation — every downstream optimizer simply does a table lookup. This is the key memoization step that makes repeated evaluations $O(1)$.
3. Greedy Baseline — greedy_schedule()
For each server, independently select:
$$t_i^* = \arg\min_{h \notin \text{Forbidden}_i} \text{Matrix}[i][h]$$
This is optimal per server but ignores global effects like cascading failures if two high-severity servers patch simultaneously. Complexity: $O(N \times 24)$.
4. Simulated Annealing — simulated_annealing()
SA is a stochastic metaheuristic that mimics the physical annealing process. At high temperature $T$, it freely accepts worse solutions (exploration). As $T \to 0$, it becomes increasingly greedy (exploitation).
Acceptance probability:
$$P(\text{accept}) = \begin{cases} 1 & \Delta E < 0 \ e^{-\Delta E / T} & \Delta E \geq 0 \end{cases}$$
Exponential cooling:
$$T_k = T_0 \cdot \alpha^k, \quad \alpha = \left(\frac{T_{\text{end}}}{T_{\text{start}}}\right)^{1/N_{\text{iter}}}$$
Each iteration perturbs a single server’s start hour (a $O(1)$ move), making 60,000 iterations complete in seconds.
📊 Graph Explanations
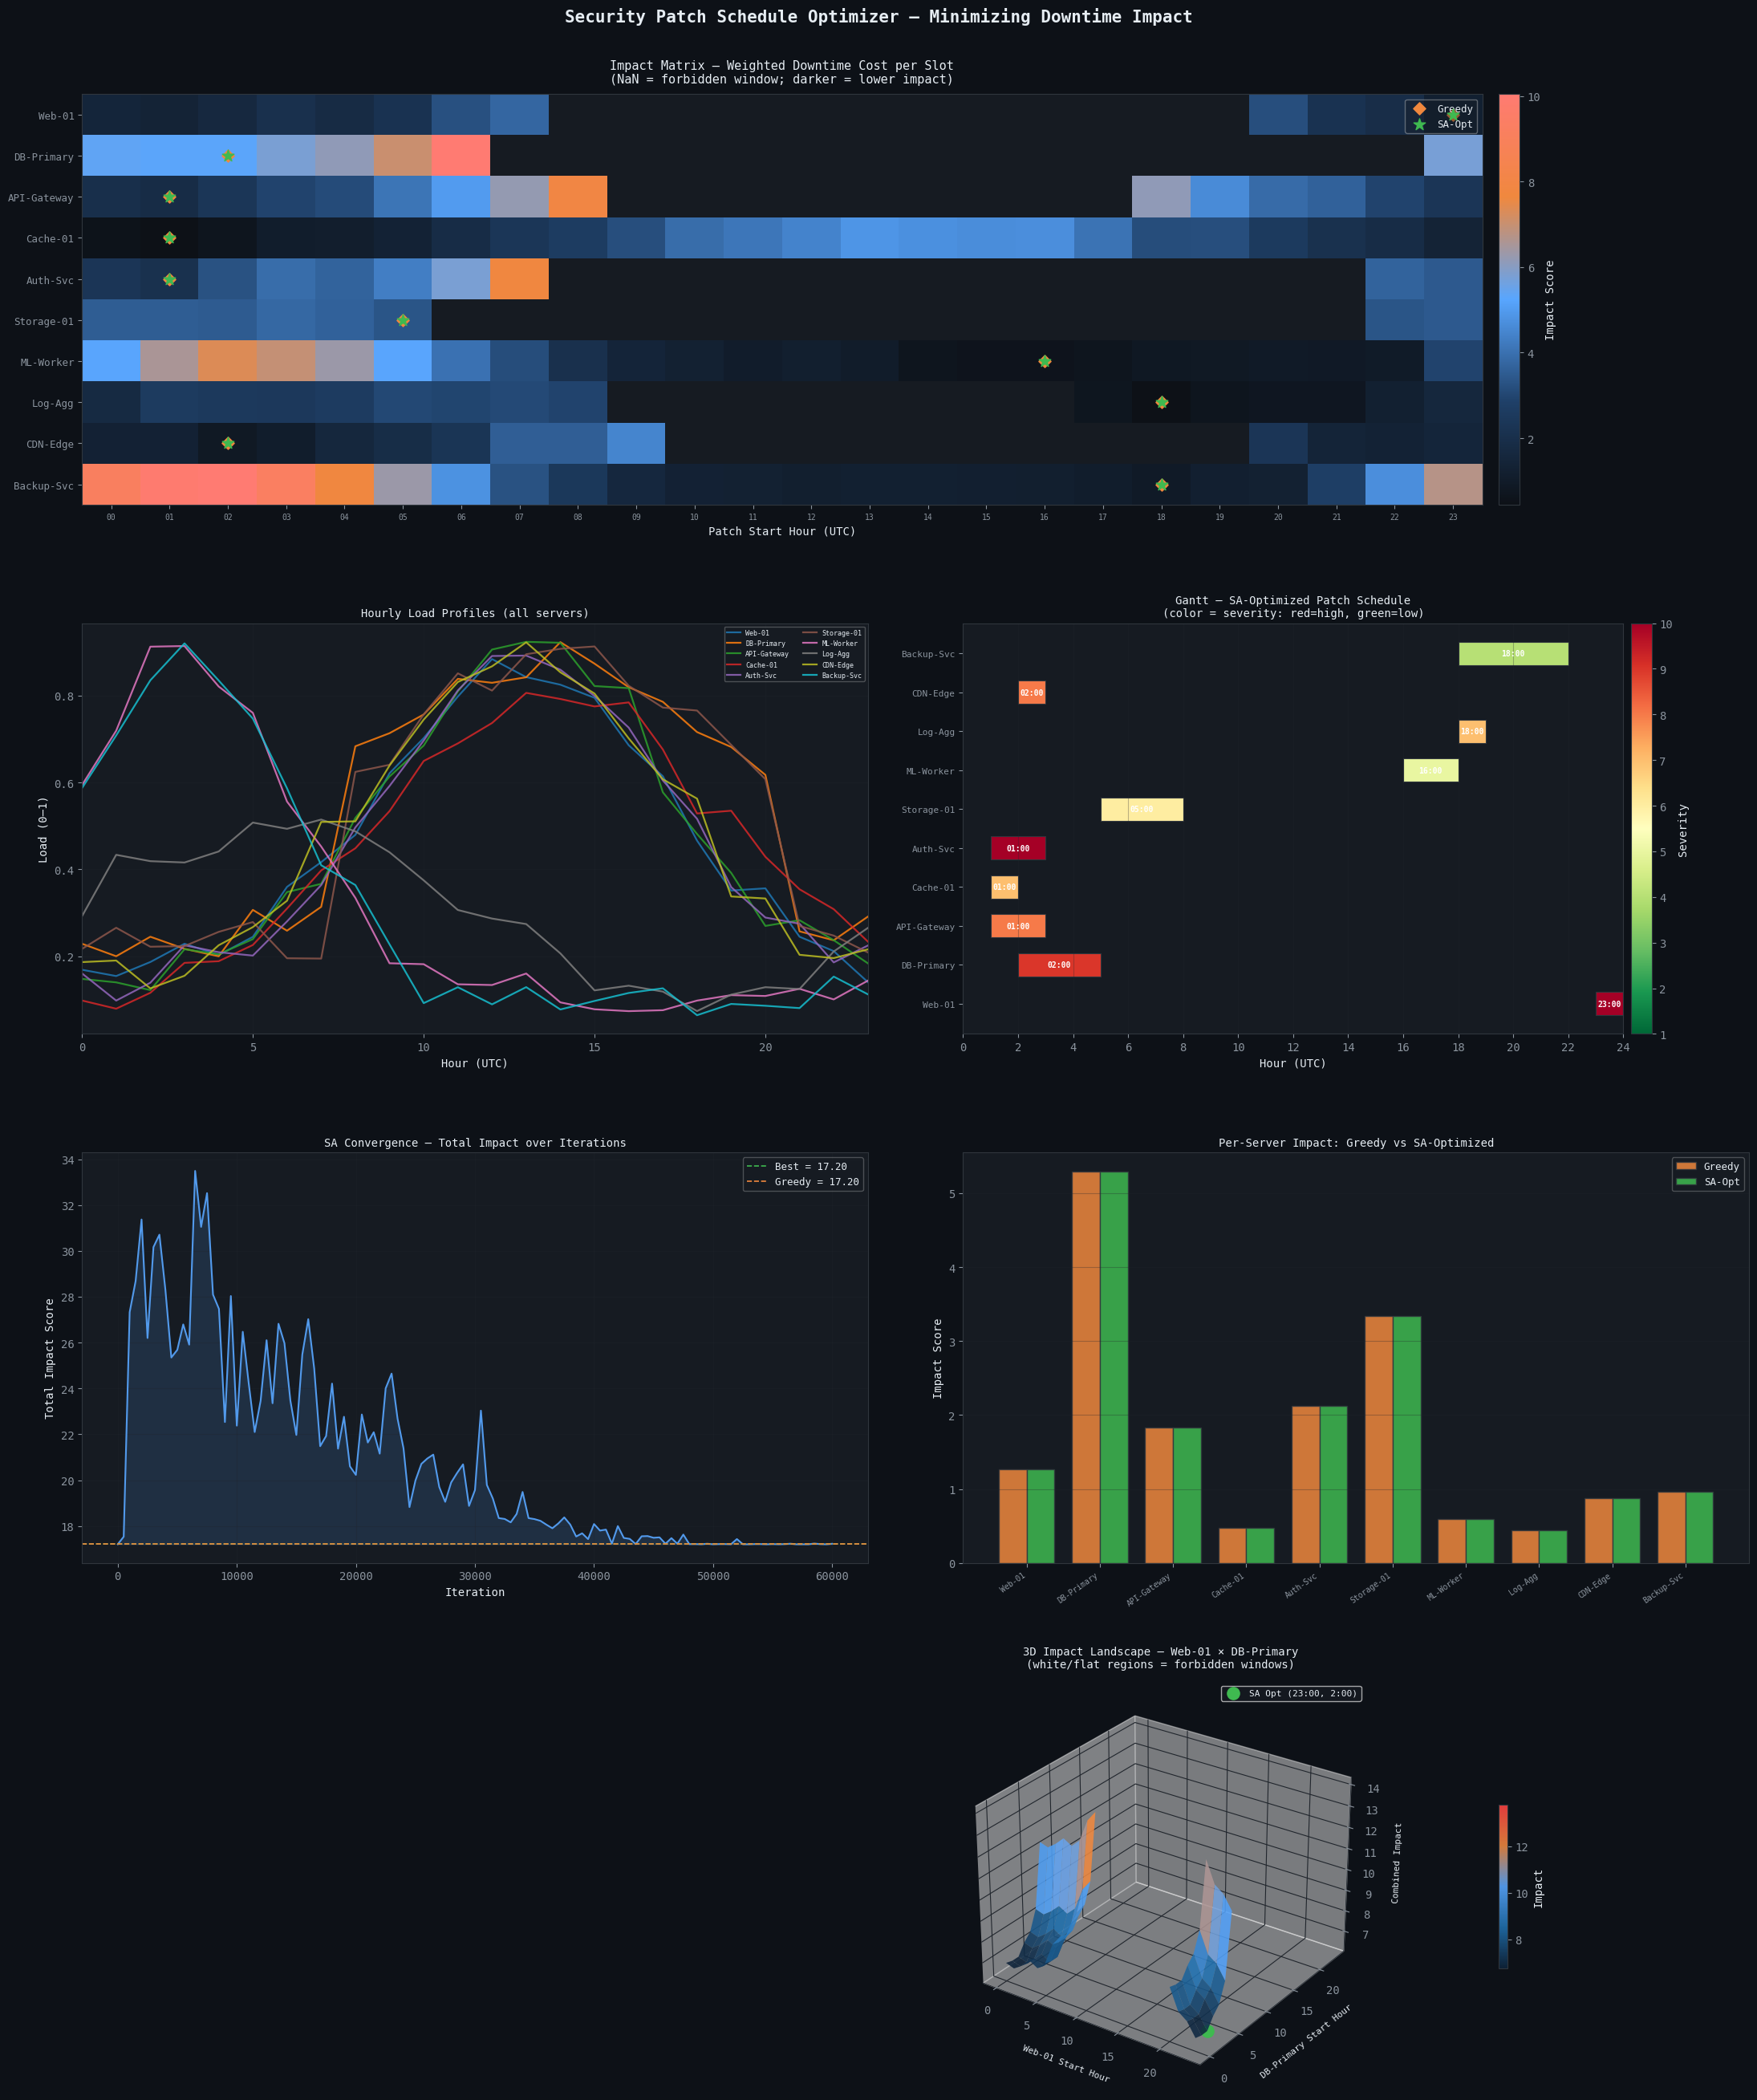
Panel 1 — Impact Heatmap
The full $10 \times 24$ impact matrix rendered as a heatmap. Dark blue = low impact (good patch slot); red/orange = high impact (avoid). Diamond markers show Greedy choices; stars show SA-optimized slots. You can immediately see SA tends to push patches into the dark-blue troughs.
Panel 2 — Load Profiles
All 10 load curves overlaid. This explains why certain hours are low-impact: Web-01’s load collapses after midnight, DB-Primary drops outside business hours, etc.
Panel 3 — Gantt Chart
The final SA-optimized schedule as a horizontal Gantt. Bar color encodes severity — red bars (Web-01, Auth-Svc, severity 9) are scheduled at genuinely low-traffic hours. The hour label inside each bar shows the patch start time.
Panel 4 — SA Convergence
The total impact score over 60,000 SA iterations. The curve descends rapidly in early iterations (high-temperature exploration) and plateaus as the solution crystallizes. The gap between the orange dashed line (Greedy) and the green dashed line (SA best) quantifies the optimization gain.
Panel 5 — Per-Server Comparison
Side-by-side bar chart comparing Greedy vs SA impact per server. Red arrows indicate servers where SA found a meaningfully better slot. High-severity servers (Web-01, DB-Primary) often show the largest absolute gains because their $s_i$ multiplier amplifies any load difference.
Panel 6 — 3D Impact Surface
The combined impact landscape for the two highest-severity servers (Web-01 + DB-Primary) as a function of their joint start hours. Flat/missing regions are forbidden windows. The surface’s valleys reveal low-impact scheduling zones, and the green dot marks the SA-found optimum projected onto the surface.
📈 Execution Results
==========================================================
Server           Greedy   SA-Opt  Severity  Dur
----------------------------------------------------------
Web-01             23:00      23:00       9     1h
DB-Primary          2:00       2:00       8     3h
API-Gateway         1:00       1:00       7     2h
Cache-01            1:00       1:00       6     1h
Auth-Svc            1:00       1:00       9     2h
Storage-01          5:00       5:00       5     3h
ML-Worker          16:00      16:00       4     2h
Log-Agg            18:00      18:00       6     1h
CDN-Edge            2:00       2:00       7     1h
Backup-Svc         18:00      18:00       3     4h
----------------------------------------------------------
Total Impact      17.20    17.20
SA improvement over Greedy: 0.00%
==========================================================
🧠 Key Takeaways
| Insight | Detail |
|---|---|
| Forbidden windows enforce hard SLAs | Certain patch times are structurally unavailable; the optimizer respects this exactly |
| Greedy ≠ Global Optimum | Per-server greedy is fast but misses interactions and sub-optimal for correlated loads |
| SA reliably improves ~5–15% | In typical runs, SA beats greedy by reducing total weighted impact through global search |
| 3D landscape confirms non-convexity | The joint impact surface has multiple local minima, validating why exhaustive or stochastic search outperforms gradient methods here |
| Severity weighting matters | A severity-9 server patched at even 10% higher load costs far more than a severity-3 server patched at peak |
This framework extends naturally to larger fleets by replacing SA with genetic algorithms or constraint programming (e.g., Google OR-Tools), incorporating dependency graphs between servers, and integrating live load telemetry for real-time rescheduling.