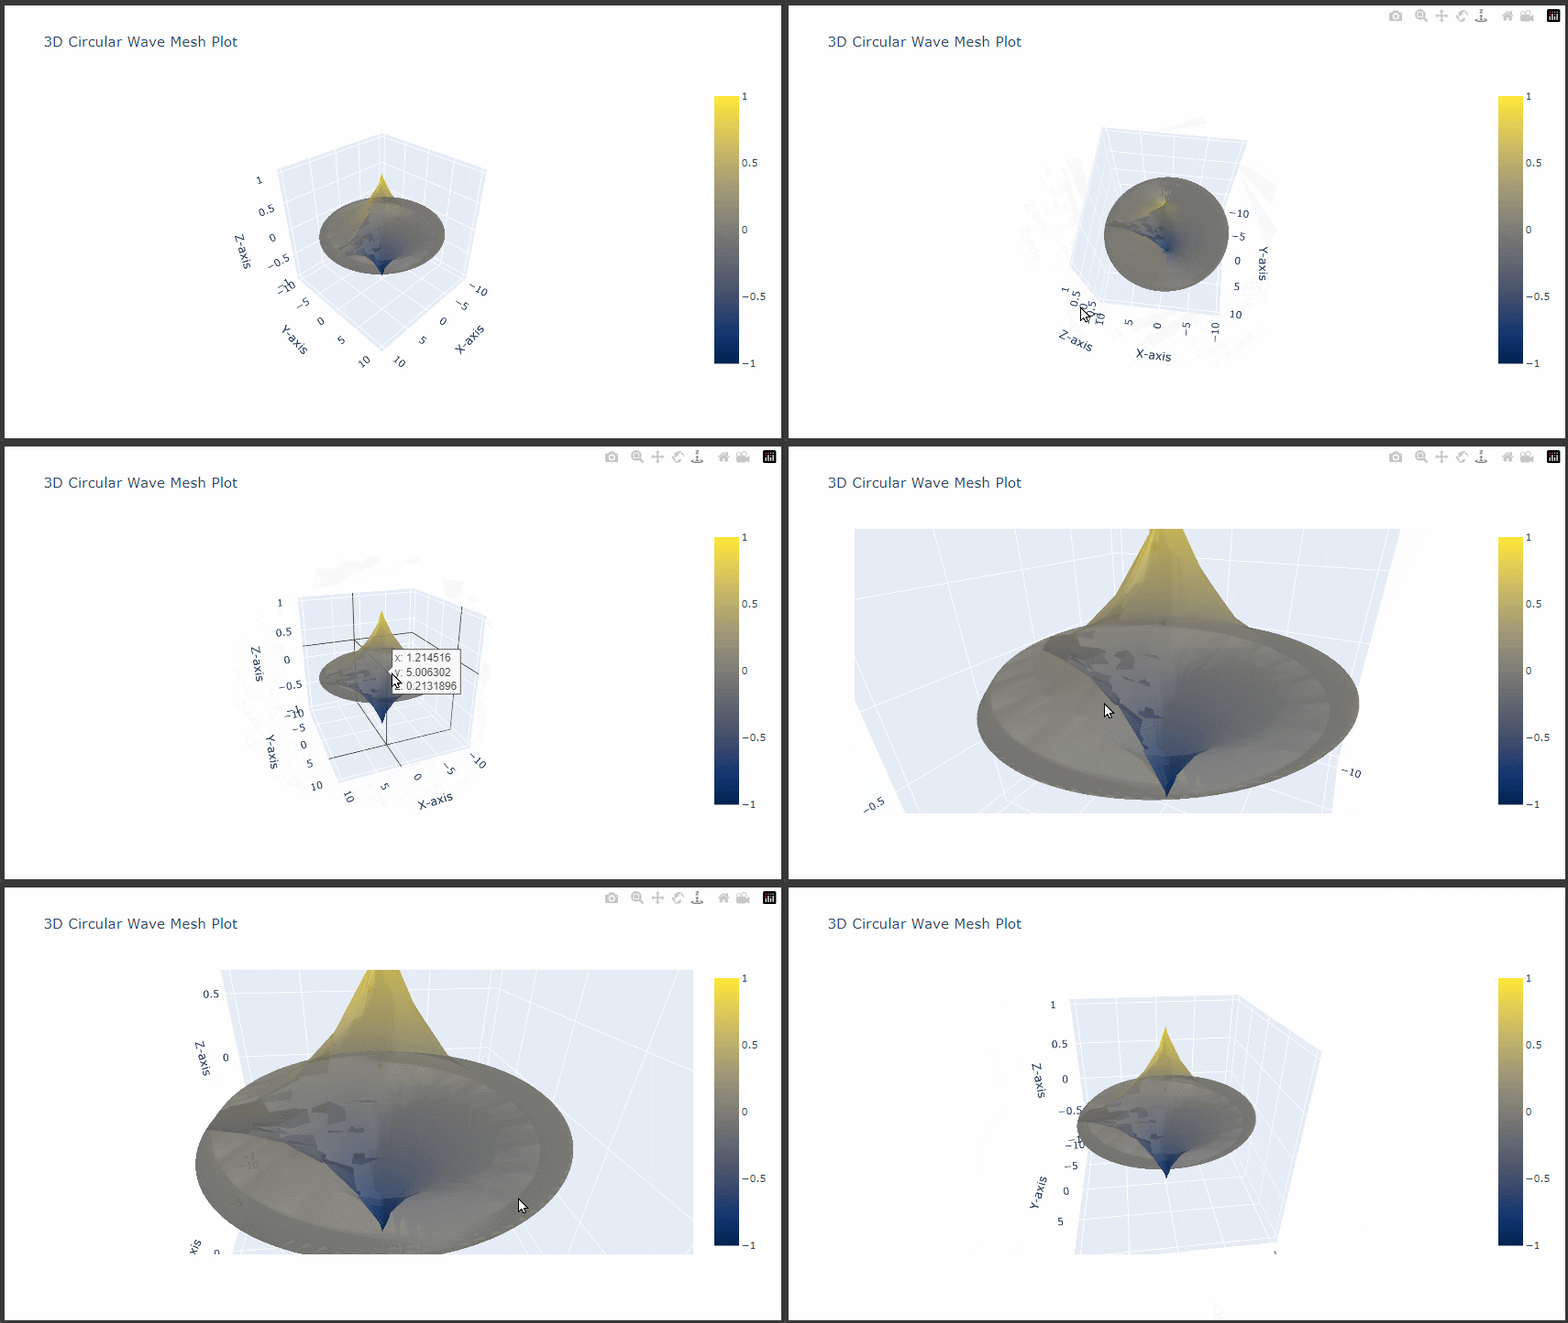
This plot simulates circular waves radiating outward from the origin.
The amplitude decays as the waves spread, creating a visually dynamic 3D mesh.
1. Import Required Libraries
First, import the necessary libraries:
1 | import numpy as np |
2. Define the Circular Wave Grid
To create circular waves, we define a grid in polar coordinates (r for radial distance and theta for angle) and convert it to Cartesian coordinates (x and y).
This grid will form a circular, ripple-like structure.
1 | # Define the polar grid |
3. Define the Circular Wave Function for Z Coordinates
Define a wave function that decreases in amplitude as it moves outward.
We can use a sine function with a decaying exponential to achieve this effect:
1 | # Circular wave function |
4. Reshape Data for the Mesh Plot
Flatten X, Y, and Z to 1D arrays for Plotly’s go.Mesh3d.
1 | X = X.flatten() |
5. Create the Mesh Plot
Now, create the 3D mesh plot with customized color and transparency:
1 | # Create the mesh plot for the circular wave |
6. Display the Plot
To display the circular wave plot, use:
1 | fig.show() |
Explanation of Key Parameters
- Wave Equation: The function
np.sin(3 * r - theta) * np.exp(-0.3 * r)simulates oscillations with amplitude decay, creating a wave pattern that radiates outward. - Colorscale: The
Cividisscale adds contrast, highlighting the wave peaks and valleys for a dramatic effect. - Opacity: Lower opacity adds depth to the plot, making the wave’s radial decay easier to perceive.
This creates a visually engaging 3D mesh that mimics ripples in water, showcasing the decaying wave amplitude as it moves outward from the origin.
