アニメーション3Dグラフ
Google Colab環境を使って、アニメーションする3Dグラフを描画します。
1 | # Google Colabでの設定 |
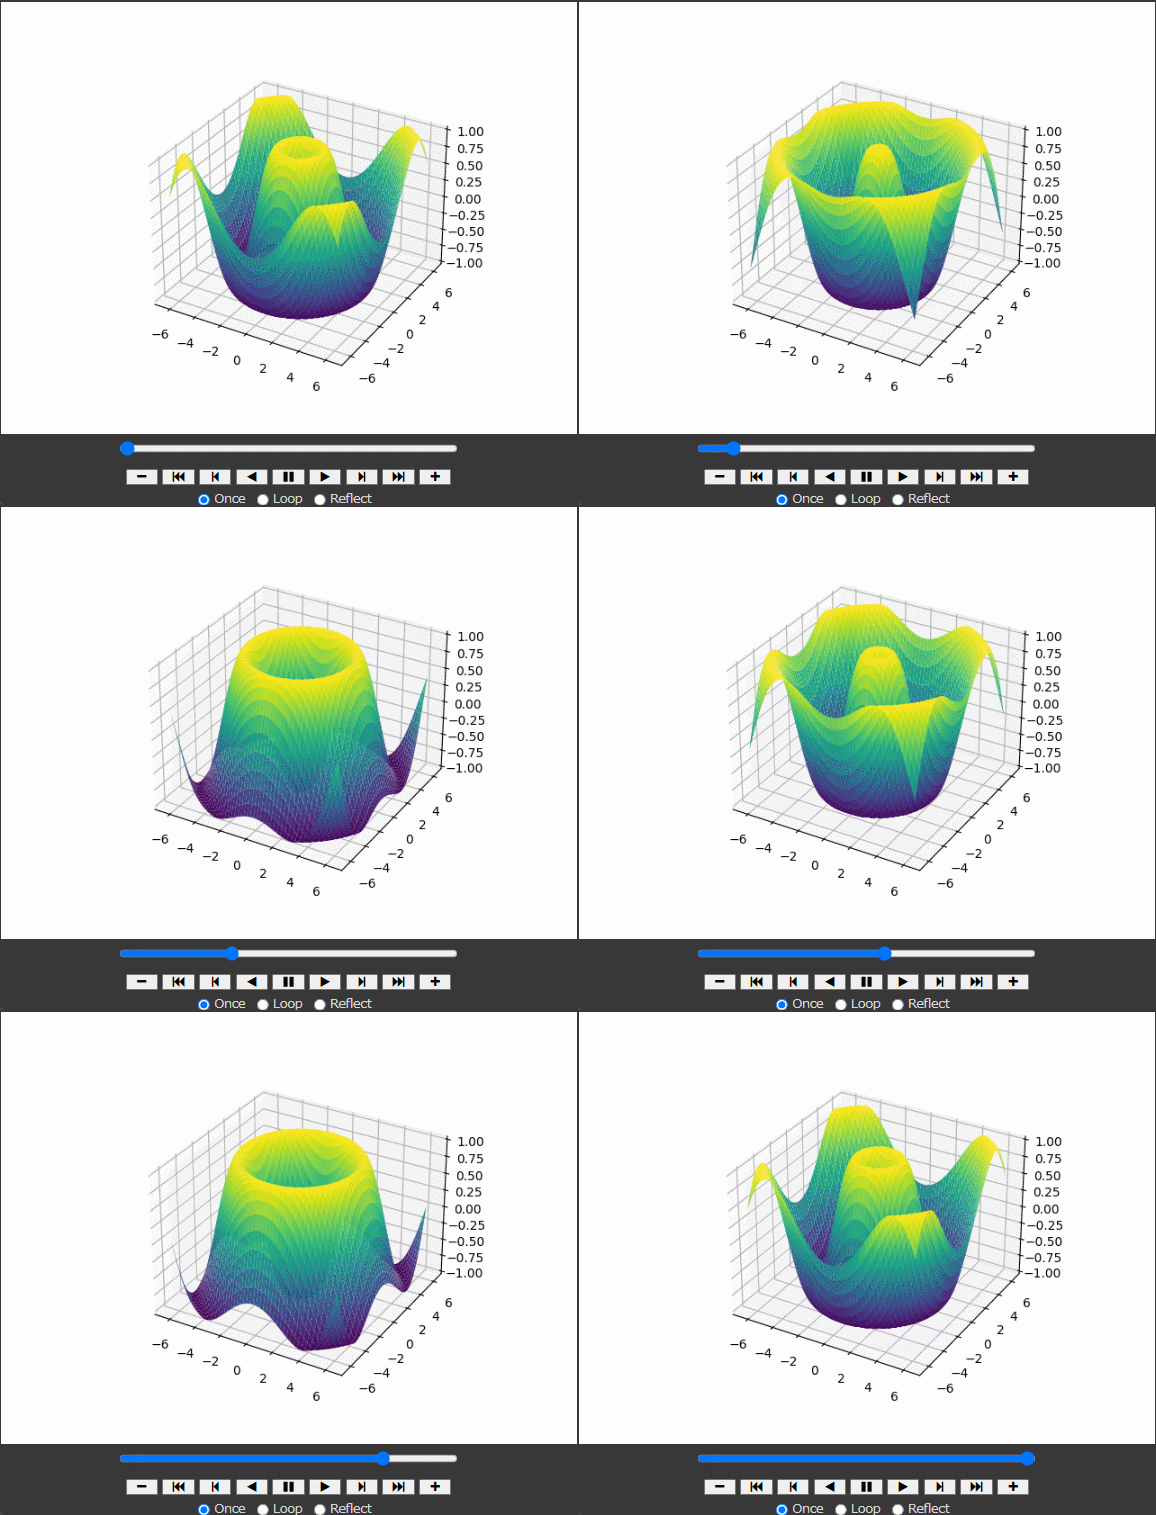
このコードでは、np.sqrt(x**2 + y**2)のようなより複雑な関数を使い、カラーマップviridisを適用しています。
これにより、アニメーションがカラフルで視覚的に魅力的になります。
【実行手順】
- Google Colabを開きます。
- 新しいノートブックを作成します。
- 上記のコードをセルにコピーして貼り付けます。
- セルを実行します。
アニメーション3Dグラフがカラフルで複雑な形状で表示されるはずです。
[実行結果]
ソースコード解説
ソースコードを詳しく説明します。
1. 必要なライブラリのインポート
1 | from IPython.display import HTML |
IPython.displayのHTML:Google ColabやJupyter NotebookでHTML形式の出力を表示するためのモジュール。numpy(np): 数値計算ライブラリ。数値データの生成と操作に使用。matplotlib.pyplot(plt): データの可視化ライブラリ。プロットの生成に使用。mpl_toolkits.mplot3dのAxes3D: 3Dプロットを生成するためのツールキット。matplotlib.animationのFuncAnimation: アニメーションを生成するためのモジュール。
2. データの生成
1 | x = np.linspace(-2 * np.pi, 2 * np.pi, 200) |
np.linspace(-2 * np.pi, 2 * np.pi, 200):-2πから2πまでの範囲を200等分した配列を生成。np.meshgrid(x, y): 2次元グリッドを生成。xとyの全ての組み合わせを含む。np.sqrt(x**2 + y**2): 各グリッドポイントのxとyの二乗和の平方根を計算。np.sin(...): 平方根の値をサイン関数に適用し、zの値を計算。
3. プロットの設定
1 | fig = plt.figure() |
plt.figure(): 新しい図(figure)を作成。fig.add_subplot(111, projection='3d'): 3Dプロットを作成するための軸(axes)を追加。
4. 初期状態のプロット
1 | line = ax.plot_surface(x, y, z, cmap='viridis') |
ax.plot_surface(x, y, z, cmap='viridis'):x,y,zのデータを用いて3Dサーフェスプロットを作成。cmap='viridis'はカラーマップを指定。
5. アニメーションの更新関数
1 | def update(frame): |
update(frame): アニメーションの各フレームで呼び出される関数。ax.clear(): 現在のプロットをクリア。z = np.sin(np.sqrt(x**2 + y**2) + frame / 10.0):zの値をフレームごとに更新。line = ax.plot_surface(x, y, z, cmap='viridis'): 更新されたzの値で新しいサーフェスプロットを作成。ax.set_zlim(-1, 1):z軸の範囲を設定。return line,: 更新されたプロットを返す。
6. アニメーションの設定
1 | ani = FuncAnimation(fig, update, frames=200, interval=50, blit=False) |
FuncAnimation(fig, update, frames=200, interval=50, blit=False): アニメーションを作成するための関数。fig: アニメーションを表示する図。update: フレームごとに呼び出される更新関数。frames=200: フレームの数。interval=50: フレーム間の時間間隔(ミリ秒)。blit=False: フル再描画を行うかどうか。
7. アニメーションをHTMLとして表示
1 | HTML(ani.to_jshtml()) |
HTML(ani.to_jshtml()): アニメーションをHTML形式に変換し、Google ColabやJupyter Notebookで表示。