回帰直線
前回記事の続きとしまして、今回は 回帰直線 を描画してみます。
(CSVファイルの読み込みと回帰モデルは前回記事で実行したものを利用します。)
散布図 を描画して、その上に 回帰直線 を描きます。
[Google Colaboratory]
1 | from matplotlib import pyplot as plt |
[実行結果]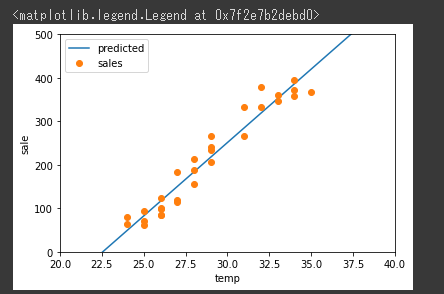
回帰直線 を表示することができました。
実測データの最高気温の最小値は24℃、最大値は35℃であり、この間では気温が 1℃上昇 すると、計算上 33.7408(回帰係数)ずつ売上が増えることを示しています。