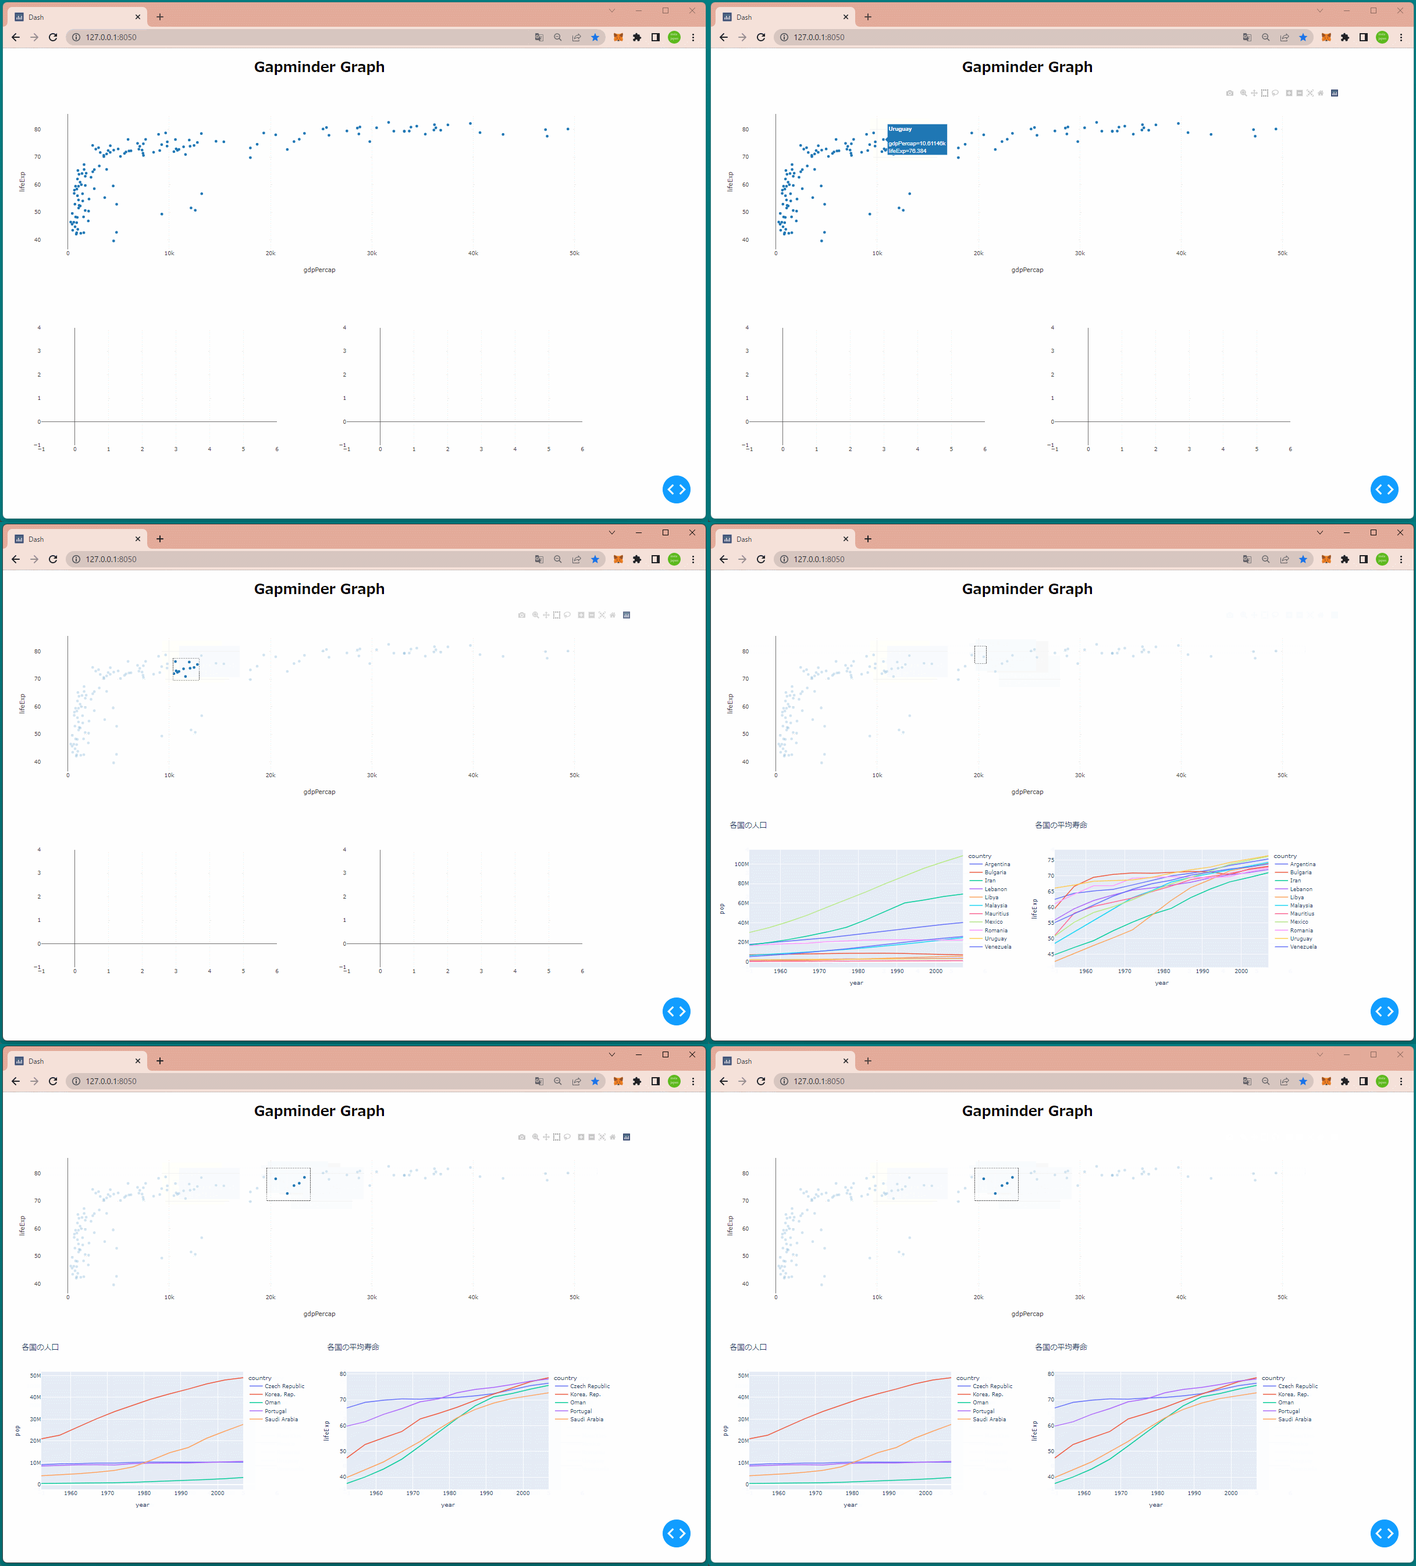
1
2
3
4
5
6
7
8
9
10
11
12
13
14
15
16
17
18
19
20
21
22
23
24
25
26
27
28
29
30
31
32
33
34
35
36
37
38
39
40
41
42
43
44
45
46
47
48
49
50
51
52
| import json
import dash
import dash_core_components as dcc
import dash_html_components as html
import plotly.express as px
from dash.dependencies import Input, Output
gapminder = px.data.gapminder()
gapminder2007 = gapminder[gapminder['year'] == 2007]
app = dash.Dash(__name__)
app.layout = html.Div(
[
html.H1('Gapminder Graph'),
dcc.Graph(
id='graph1',
figure=px.scatter(
gapminder2007, x='gdpPercap', y='lifeExp', hover_name='country',
template={'layout':{'dragmode':'select'}}
)
),
html.Div(
[
dcc.Graph(id='graph2', className='six columns'),
dcc.Graph(id='graph3', className='six columns')
]
)
],
style={'width':'90%', 'fontSize':'40', 'textAlign':'center'}
)
@app.callback(
Output('graph2', 'figure'),
Output('graph3', 'figure'),
Input('graph1', 'selectedData')
)
def show_text(selectedData):
if selectedData:
selected_countries = [data['hovertext'] for data in selectedData['points']]
selected_df = gapminder[gapminder['country'].isin(selected_countries)]
fig2 = px.line(selected_df, x='year', y='pop', color='country', title='各国の人口')
fig3 = px.line(selected_df, x='year', y='lifeExp', color='country', title='各国の平均寿命')
return fig2, fig3
raise dash.exceptions.PreventUpdate
if __name__ == '__main__':
app.run_server(debug=True)
|
