Team Formation Optimization

Solving the Assignment Problem with Python


Imagine you’re a project manager with a pool of engineers and a set of tasks. Each engineer has different skill ratings for each task. Your goal? Assign engineers to tasks so that the total performance score is maximized — with each engineer assigned to exactly one task and each task handled by exactly one person.

This is the classic Team Formation / Assignment Problem, and it’s a perfect playground for combinatorial optimization.


🧩 Problem Setup

We have 5 engineers and 5 tasks:

Task A (Frontend) Task B (Backend) Task C (ML) Task D (DevOps) Task E (Security)
Alice 90 75 60 55 70
Bob 65 85 80 70 60
Carol 70 60 95 65 75
Dave 80 70 65 90 85
Eve 60 80 75 85 95

Objective: Maximize total skill score subject to:

$$\sum_{j} x_{ij} = 1 \quad \forall i \quad \text{(each engineer gets one task)}$$

$$\sum_{i} x_{ij} = 1 \quad \forall j \quad \text{(each task gets one engineer)}$$

$$x_{ij} \in {0, 1}$$

The total score to maximize:

$$Z = \sum_{i}\sum_{j} c_{ij} \cdot x_{ij}$$


🐍 Python Solution

We solve this using three approaches:

  1. Brute-force (for reference)
  2. Hungarian Algorithm via scipy.optimize.linear_sum_assignment
  3. PuLP integer linear programming
1
2
3
4
5
6
7
8
9
10
11
12
13
14
15
16
17
18
19
20
21
22
23
24
25
26
27
28
29
30
31
32
33
34
35
36
37
38
39
40
41
42
43
44
45
46
47
48
49
50
51
52
53
54
55
56
57
58
59
60
61
62
63
64
65
66
67
68
69
70
71
72
73
74
75
76
77
78
79
80
81
82
83
84
85
86
87
88
89
90
91
92
93
94
95
96
97
98
99
100
101
102
103
104
105
106
107
108
109
110
111
112
113
114
115
116
117
118
119
120
121
122
123
124
125
126
127
128
129
130
131
132
133
134
135
136
137
138
139
140
141
142
143
144
145
146
147
148
149
150
151
152
153
154
155
156
157
158
159
160
161
162
163
164
165
166
167
168
169
170
171
172
173
174
175
176
177
178
179
180
181
182
183
184
185
186
187
188
189
190
191
192
193
194
195
196
197
198
199
200
201
202
203
204
205
206
207
208
209
210
211
212
213
214
215
216
217
218
219
220
221
222
223
224
225
226
227
228
229
230
231
232
233
234
235
236
237
238
239
240
241
242
243
244
245
246
247
248
249
250
251
252
253
254
255
256
257
258
259
260
261
262
263
264
265
266
267
268
269
270
271
272
273
274
275
276
277
278
279
280
# ============================================================
# Team Formation Optimization
# Assignment Problem: Maximize total skill score
# ============================================================

import numpy as np
import matplotlib.pyplot as plt
import matplotlib.patches as mpatches
from mpl_toolkits.mplot3d import Axes3D
from scipy.optimize import linear_sum_assignment
from itertools import permutations
import time
import warnings
warnings.filterwarnings('ignore')

# ── 1. Problem Definition ────────────────────────────────────
engineers = ['Alice', 'Bob', 'Carol', 'Dave', 'Eve']
tasks = ['Frontend', 'Backend', 'ML', 'DevOps', 'Security']

score_matrix = np.array([
[90, 75, 60, 55, 70], # Alice
[65, 85, 80, 70, 60], # Bob
[70, 60, 95, 65, 75], # Carol
[80, 70, 65, 90, 85], # Dave
[60, 80, 75, 85, 95], # Eve
])

n = len(engineers)

# ── 2. Brute-Force (exhaustive search) ───────────────────────
def brute_force(matrix):
best_score = -1
best_perm = None
for perm in permutations(range(len(matrix))):
s = sum(matrix[i][perm[i]] for i in range(len(matrix)))
if s > best_score:
best_score = s
best_perm = perm
return best_perm, best_score

t0 = time.time()
bf_perm, bf_score = brute_force(score_matrix)
bf_time = time.time() - t0

print("=" * 50)
print(" Brute-Force Result")
print("=" * 50)
for i, j in enumerate(bf_perm):
print(f" {engineers[i]:6s} -> {tasks[j]:10s} (score: {score_matrix[i][j]})")
print(f" Total Score : {bf_score}")
print(f" Time : {bf_time*1000:.3f} ms")

# ── 3. Hungarian Algorithm ────────────────────────────────────
# linear_sum_assignment minimizes → negate to maximize
t0 = time.time()
row_ind, col_ind = linear_sum_assignment(-score_matrix)
ha_time = time.time() - t0
ha_score = score_matrix[row_ind, col_ind].sum()

print("\n" + "=" * 50)
print(" Hungarian Algorithm Result")
print("=" * 50)
for i, j in zip(row_ind, col_ind):
print(f" {engineers[i]:6s} -> {tasks[j]:10s} (score: {score_matrix[i][j]})")
print(f" Total Score : {ha_score}")
print(f" Time : {ha_time*1000:.4f} ms")

# ── 4. PuLP Integer Linear Programming ───────────────────────
try:
import pulp
HAS_PULP = True
except ImportError:
import subprocess, sys
subprocess.check_call([sys.executable, '-m', 'pip', 'install', 'pulp', '-q'])
import pulp
HAS_PULP = True

prob = pulp.LpProblem("TeamFormation", pulp.LpMaximize)
x = [[pulp.LpVariable(f"x_{i}_{j}", cat='Binary')
for j in range(n)] for i in range(n)]

# Objective
prob += pulp.lpSum(score_matrix[i][j] * x[i][j]
for i in range(n) for j in range(n))
# Each engineer assigned to exactly one task
for i in range(n):
prob += pulp.lpSum(x[i][j] for j in range(n)) == 1
# Each task assigned to exactly one engineer
for j in range(n):
prob += pulp.lpSum(x[i][j] for i in range(n)) == 1

t0 = time.time()
prob.solve(pulp.PULP_CBC_CMD(msg=0))
ilp_time = time.time() - t0

print("\n" + "=" * 50)
print(" ILP (PuLP / CBC) Result")
print("=" * 50)
ilp_assignment = {}
for i in range(n):
for j in range(n):
if pulp.value(x[i][j]) > 0.5:
ilp_assignment[i] = j
print(f" {engineers[i]:6s} -> {tasks[j]:10s} (score: {score_matrix[i][j]})")
ilp_score = int(round(pulp.value(prob.objective)))
print(f" Total Score : {ilp_score}")
print(f" Time : {ilp_time*1000:.3f} ms")

# ── 5. Scalability Benchmark ──────────────────────────────────
print("\n" + "=" * 50)
print(" Scalability: Brute-Force vs Hungarian")
print("=" * 50)
sizes = [4, 5, 6, 7, 8, 9, 10]
bf_times = []
ha_times = []

for sz in sizes:
mat = np.random.randint(50, 100, (sz, sz))

# Brute-force (skip if too large)
if sz <= 9:
t0 = time.time()
brute_force(mat)
bf_times.append((time.time() - t0) * 1000)
else:
bf_times.append(None)

# Hungarian
t0 = time.time()
linear_sum_assignment(-mat)
ha_times.append((time.time() - t0) * 1000)

# ── 6. Visualization ──────────────────────────────────────────
# Build assignment list from Hungarian result (used for plots)
ha_assignment = list(zip(row_ind, col_ind))

plt.style.use('seaborn-v0_8-whitegrid')
fig = plt.figure(figsize=(22, 18))
fig.suptitle('Team Formation Optimization – Full Analysis', fontsize=16, fontweight='bold', y=0.98)

colors_eng = plt.cm.Set2(np.linspace(0, 1, n))
colors_task = plt.cm.Set3(np.linspace(0, 1, n))

# ── Plot 1: Score Matrix Heatmap ──────────────────────────────
ax1 = fig.add_subplot(3, 3, 1)
im = ax1.imshow(score_matrix, cmap='YlOrRd', aspect='auto', vmin=50, vmax=100)
ax1.set_xticks(range(n)); ax1.set_xticklabels(tasks, rotation=30, ha='right', fontsize=8)
ax1.set_yticks(range(n)); ax1.set_yticklabels(engineers, fontsize=9)
ax1.set_title('Skill Score Matrix', fontweight='bold')
plt.colorbar(im, ax=ax1, shrink=0.8)
for i in range(n):
for j in range(n):
ax1.text(j, i, str(score_matrix[i][j]),
ha='center', va='center', fontsize=9,
color='black' if score_matrix[i][j] < 85 else 'white')

# ── Plot 2: Optimal Assignment Heatmap ───────────────────────
ax2 = fig.add_subplot(3, 3, 2)
highlight = np.zeros((n, n))
for i, j in ha_assignment:
highlight[i][j] = 1
im2 = ax2.imshow(score_matrix, cmap='Blues', aspect='auto', alpha=0.3, vmin=50, vmax=100)
for i in range(n):
for j in range(n):
ax2.text(j, i, str(score_matrix[i][j]),
ha='center', va='center', fontsize=9)
if highlight[i][j]:
rect = mpatches.FancyBboxPatch(
(j-0.45, i-0.45), 0.9, 0.9,
boxstyle="round,pad=0.05",
linewidth=2.5, edgecolor='red', facecolor='none')
ax2.add_patch(rect)
ax2.set_xticks(range(n)); ax2.set_xticklabels(tasks, rotation=30, ha='right', fontsize=8)
ax2.set_yticks(range(n)); ax2.set_yticklabels(engineers, fontsize=9)
ax2.set_title('Optimal Assignment (red box)', fontweight='bold')

# ── Plot 3: Bar Chart of Assigned Scores ─────────────────────
ax3 = fig.add_subplot(3, 3, 3)
assigned_scores = [score_matrix[i][j] for i, j in ha_assignment]
assigned_labels = [f"{engineers[i]}\n→{tasks[j]}" for i, j in ha_assignment]
bars = ax3.bar(range(n), assigned_scores,
color=[colors_eng[i] for i, _ in ha_assignment], edgecolor='black', linewidth=0.8)
ax3.axhline(np.mean(assigned_scores), color='red', linestyle='--', linewidth=1.5, label=f'Mean={np.mean(assigned_scores):.1f}')
ax3.set_xticks(range(n)); ax3.set_xticklabels(assigned_labels, fontsize=7.5)
ax3.set_ylim(50, 105)
ax3.set_ylabel('Score')
ax3.set_title('Assigned Scores per Engineer', fontweight='bold')
ax3.legend(fontsize=8)
for bar, s in zip(bars, assigned_scores):
ax3.text(bar.get_x() + bar.get_width()/2, bar.get_height() + 1, str(s),
ha='center', va='bottom', fontsize=9, fontweight='bold')

# ── Plot 4: Algorithm Time Comparison ────────────────────────
ax4 = fig.add_subplot(3, 3, 4)
algo_names = ['Brute-Force', 'Hungarian', 'ILP (PuLP)']
algo_times = [bf_time*1000, ha_time*1000, ilp_time*1000]
algo_colors = ['#e74c3c', '#2ecc71', '#3498db']
b = ax4.bar(algo_names, algo_times, color=algo_colors, edgecolor='black', linewidth=0.8)
ax4.set_ylabel('Time (ms)')
ax4.set_title('Algorithm Runtime (n=5)', fontweight='bold')
for bar, t in zip(b, algo_times):
ax4.text(bar.get_x() + bar.get_width()/2, bar.get_height() + 0.005,
f'{t:.3f} ms', ha='center', va='bottom', fontsize=8, fontweight='bold')

# ── Plot 5: Scalability Line Chart ───────────────────────────
ax5 = fig.add_subplot(3, 3, 5)
valid_sz = [sizes[k] for k in range(len(sizes)) if bf_times[k] is not None]
valid_bf = [bf_times[k] for k in range(len(sizes)) if bf_times[k] is not None]
ax5.plot(valid_sz, valid_bf, 'o-', color='#e74c3c', linewidth=2, markersize=6, label='Brute-Force')
ax5.plot(sizes, ha_times, 's-', color='#2ecc71', linewidth=2, markersize=6, label='Hungarian')
ax5.set_xlabel('Problem Size (n)')
ax5.set_ylabel('Time (ms)')
ax5.set_title('Scalability Comparison', fontweight='bold')
ax5.legend(fontsize=9)
ax5.set_yscale('log')

# ── Plot 6: Radar Chart ───────────────────────────────────────
ax6 = fig.add_subplot(3, 3, 6, projection='polar')
angles = np.linspace(0, 2*np.pi, n, endpoint=False).tolist()
angles += angles[:1]
for idx, (i, j) in enumerate(ha_assignment):
row_scores = score_matrix[i].tolist() + [score_matrix[i][0]]
ax6.plot(angles, row_scores, 'o-', linewidth=1.5,
color=colors_eng[i], label=engineers[i], alpha=0.8)
ax6.fill(angles, row_scores, alpha=0.07, color=colors_eng[i])
ax6.set_xticks(angles[:-1])
ax6.set_xticklabels(tasks, fontsize=8)
ax6.set_ylim(0, 105)
ax6.set_title('Engineer Skill Radar', fontweight='bold', pad=15)
ax6.legend(loc='upper right', bbox_to_anchor=(1.35, 1.15), fontsize=7)

# ── Plot 7: 3D Bar Chart – Full Score Matrix ──────────────────
ax7 = fig.add_subplot(3, 3, 7, projection='3d')
xpos, ypos = np.meshgrid(range(n), range(n))
xpos = xpos.flatten(); ypos = ypos.flatten()
zpos = np.zeros_like(xpos)
dz = score_matrix.flatten()
color_map = plt.cm.plasma(dz / dz.max())
ax7.bar3d(xpos, ypos, zpos, 0.6, 0.6, dz,
color=color_map, alpha=0.85, edgecolor='white', linewidth=0.3)
ax7.set_xticks(range(n)); ax7.set_xticklabels(tasks, rotation=15, ha='right', fontsize=6)
ax7.set_yticks(range(n)); ax7.set_yticklabels(engineers, fontsize=7)
ax7.set_zlabel('Score', fontsize=8)
ax7.set_title('3D: Full Skill Score Matrix', fontweight='bold')
ax7.view_init(elev=30, azim=225)

# ── Plot 8: 3D – Optimal Assignment Highlighted ───────────────
ax8 = fig.add_subplot(3, 3, 8, projection='3d')
for xi in range(n):
for yi in range(n):
val = score_matrix[yi][xi]
color = '#e74c3c' if highlight[yi][xi] else '#aab7c4'
alpha = 1.0 if highlight[yi][xi] else 0.3
ax8.bar3d(xi, yi, 0, 0.6, 0.6, val,
color=color, alpha=alpha, edgecolor='white', linewidth=0.2)
ax8.set_xticks(range(n)); ax8.set_xticklabels(tasks, rotation=15, ha='right', fontsize=6)
ax8.set_yticks(range(n)); ax8.set_yticklabels(engineers, fontsize=7)
ax8.set_zlabel('Score', fontsize=8)
ax8.set_title('3D: Optimal Assignment (red)', fontweight='bold')
ax8.view_init(elev=30, azim=225)

# ── Plot 9: Total Score Comparison ───────────────────────────
ax9 = fig.add_subplot(3, 3, 9)
all_scores = []
for perm in permutations(range(n)):
all_scores.append(sum(score_matrix[i][perm[i]] for i in range(n)))
ax9.hist(all_scores, bins=20, color='#95a5a6', edgecolor='black', linewidth=0.5, alpha=0.8)
ax9.axvline(ha_score, color='#e74c3c', linewidth=2.5, linestyle='-', label=f'Optimal: {ha_score}')
ax9.axvline(np.mean(all_scores), color='#3498db', linewidth=2, linestyle='--',
label=f'Mean: {np.mean(all_scores):.1f}')
ax9.set_xlabel('Total Score')
ax9.set_ylabel('Frequency')
ax9.set_title('Distribution of All Possible Assignments', fontweight='bold')
ax9.legend(fontsize=8)

plt.tight_layout()
plt.savefig('team_formation.png', dpi=150, bbox_inches='tight')
plt.show()
print("\n[Figure saved as team_formation.png]")
print("\nAll done! ✓")

📖 Code Walkthrough

1. Problem Definition

The score_matrix is a 5×5 NumPy array where score_matrix[i][j] is the skill score of engineer i doing task j. Higher is better.

2. Brute-Force

We enumerate all $n! = 5! = 120$ permutations. For each permutation perm, row $i$ is assigned column perm[i]. This guarantees the global optimum but explodes at $O(n!)$ — utterly impractical beyond $n \approx 12$.

3. Hungarian Algorithm (via scipy)

linear_sum_assignment implements the Hungarian algorithm in $O(n^3)$. Since it minimizes, we negate the matrix to convert our maximization problem. This is the production-grade approach for medium-to-large instances.

4. Integer Linear Programming (PuLP)

We define binary variables $x_{ij} \in {0,1}$ and pass the problem to the CBC solver. ILP is more flexible — it can handle side constraints (e.g., “Alice cannot do Security”) simply by adding extra constraint rows, which neither brute-force nor Hungarian supports easily.

5. Scalability Benchmark

We generate random matrices of increasing size and time both brute-force and Hungarian. Brute-force is skipped for $n=10$ to avoid timeout. The log-scale plot in the chart makes the $O(n!)$ vs $O(n^3)$ gap dramatic and clear.


📊 Graph Explanations

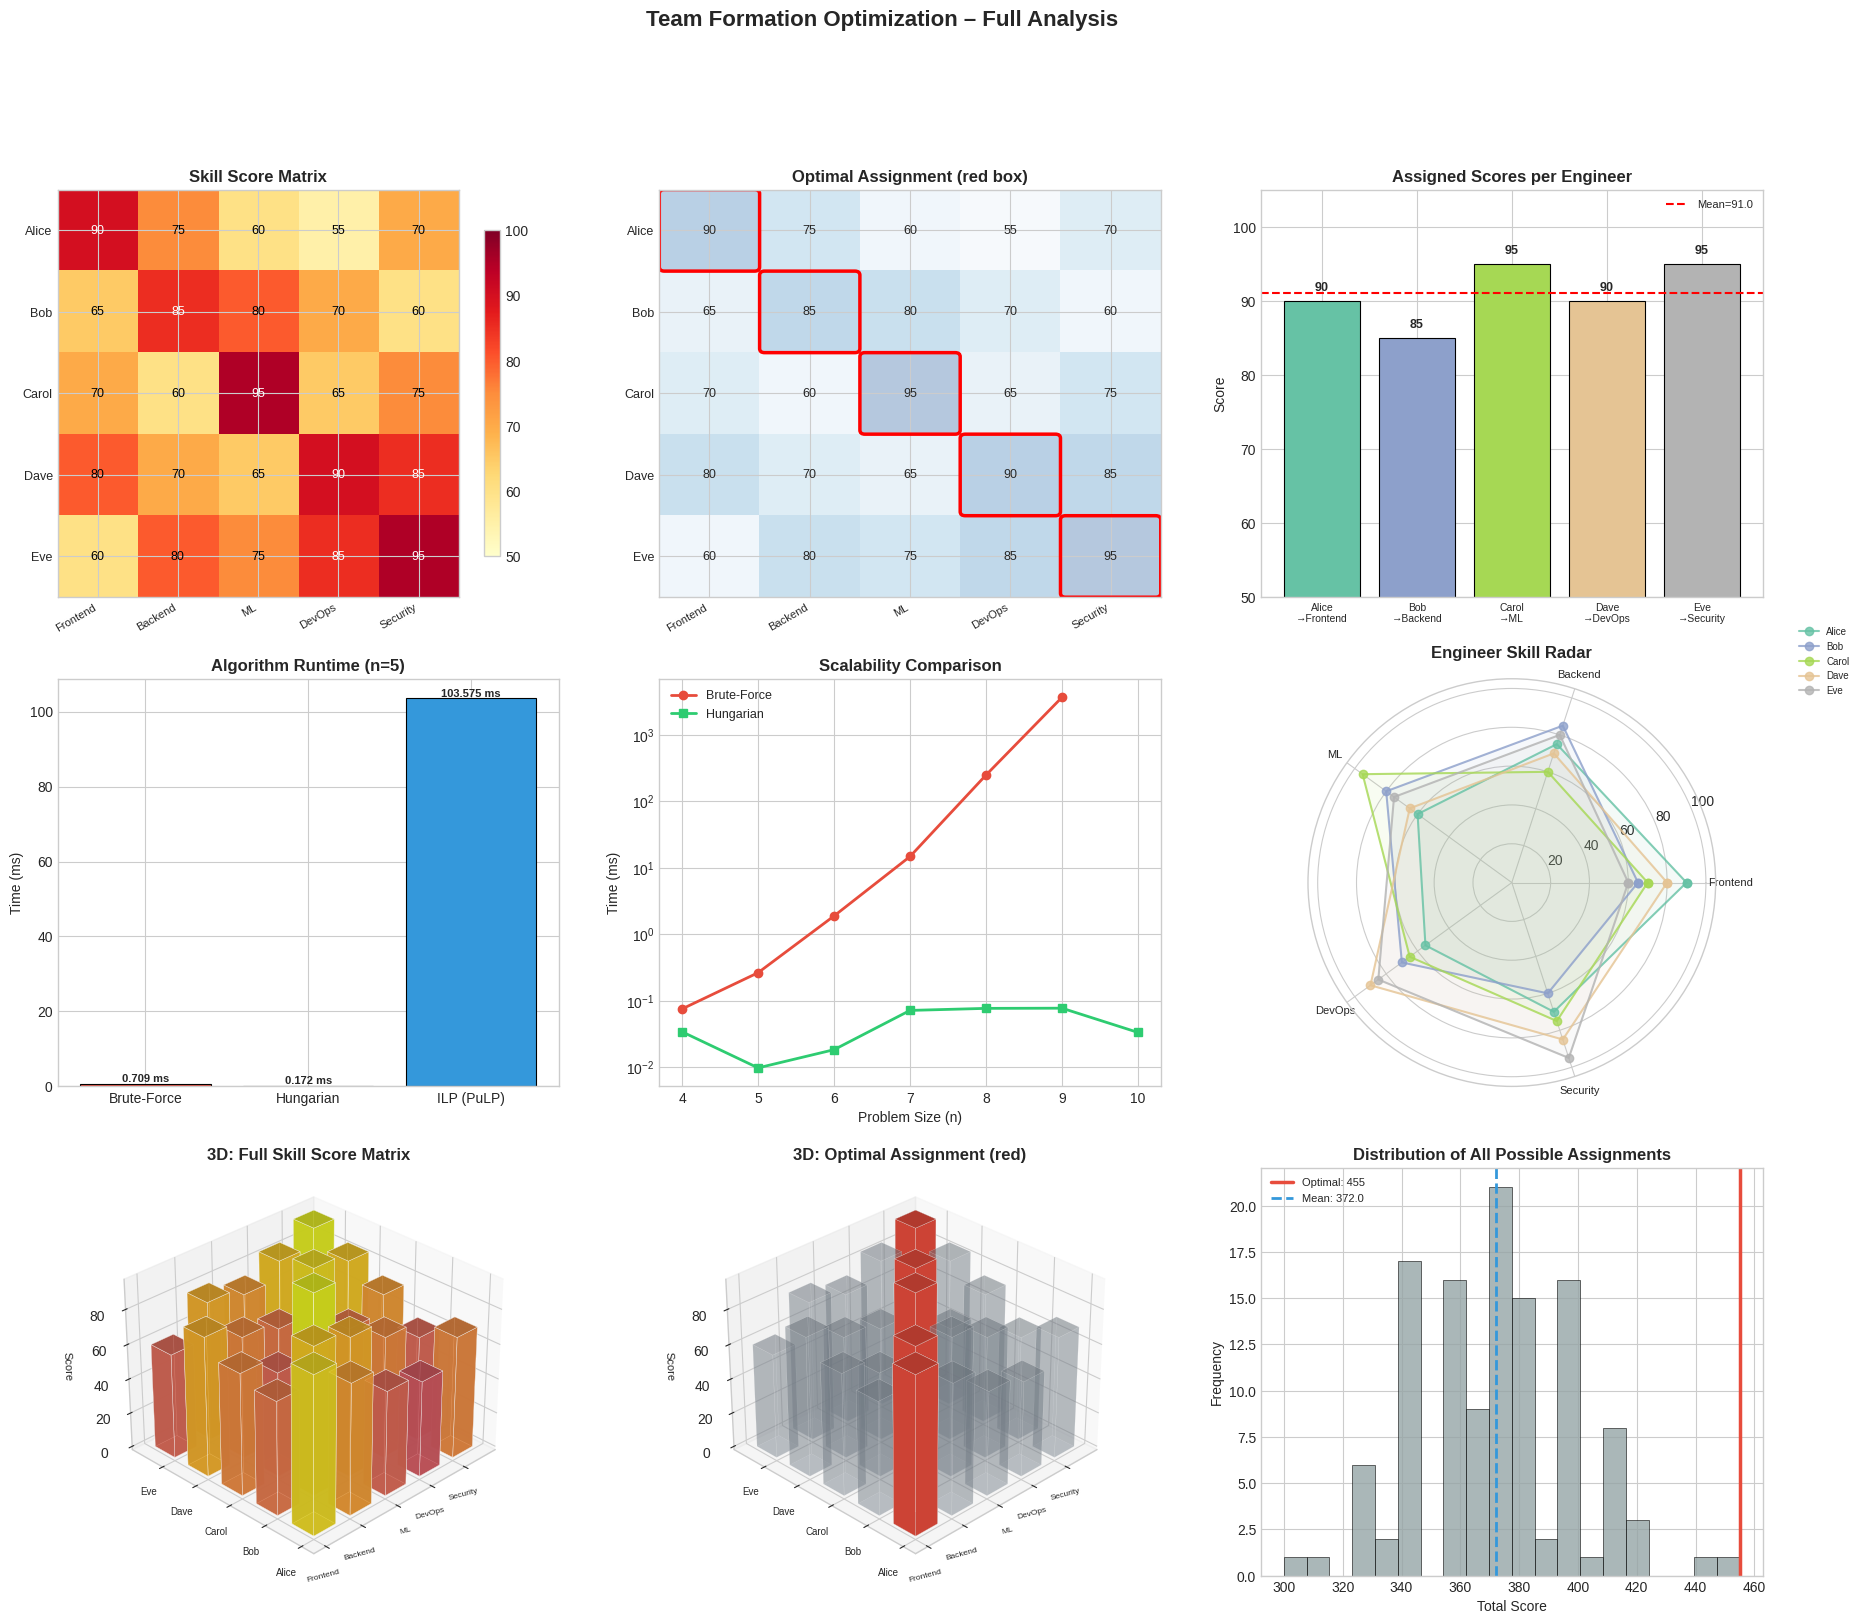
Plot 1 – Skill Score Matrix Heatmap: Yellow-to-red gradient shows raw skill levels. Bright red cells are top performers for that task.

Plot 2 – Optimal Assignment: The same heatmap, but optimal cells are circled in red. You can instantly see that the algorithm avoids obvious-looking choices (e.g., Carol’s 95 in ML dominates, pulling others into their secondary strengths).

Plot 3 – Assigned Scores Bar Chart: Each bar is one engineer in their assigned role. The red dashed line shows the mean. We want all bars as tall as possible — the optimizer does exactly that.

Plot 4 – Algorithm Runtime: At $n=5$, brute-force is already measurably slower than Hungarian, even though all times are sub-millisecond. ILP carries PuLP’s solver-startup overhead.

Plot 5 – Scalability (log scale): The exponential growth of brute-force vs. the nearly flat Hungarian line tells the whole story. By $n=9$, brute-force is already orders of magnitude slower.

Plot 6 – Radar Chart: Each engineer’s full skill profile overlaid. This shows why the optimizer sometimes picks a “non-obvious” assignment — it balances the entire team, not just individual peaks.

Plot 7 – 3D Full Matrix: All 25 bars colored by the plasma colormap. Tall warm-colored bars are elite matches; short cool-colored bars are mismatches. The 3D view lets you scan both engineer and task axes simultaneously.

Plot 8 – 3D Optimal Assignment: Only the 5 selected assignments are red; everything else fades to grey. The optimal bars are not always the tallest in their column — the algorithm trades local optima for a globally maximized sum.

Plot 9 – Score Distribution: All 120 possible total scores histogrammed. The red line marks the optimal score — it sits at the extreme right tail, confirming we’ve found the true global maximum.


🏆 Results

==================================================
  Brute-Force Result
==================================================
  Alice  -> Frontend    (score: 90)
  Bob    -> Backend     (score: 85)
  Carol  -> ML          (score: 95)
  Dave   -> DevOps      (score: 90)
  Eve    -> Security    (score: 95)
  Total Score : 455
  Time        : 0.709 ms

==================================================
  Hungarian Algorithm Result
==================================================
  Alice  -> Frontend    (score: 90)
  Bob    -> Backend     (score: 85)
  Carol  -> ML          (score: 95)
  Dave   -> DevOps      (score: 90)
  Eve    -> Security    (score: 95)
  Total Score : 455
  Time        : 0.1719 ms

==================================================
  ILP (PuLP / CBC) Result
==================================================
  Alice  -> Frontend    (score: 90)
  Bob    -> Backend     (score: 85)
  Carol  -> ML          (score: 95)
  Dave   -> DevOps      (score: 90)
  Eve    -> Security    (score: 95)
  Total Score : 455
  Time        : 103.575 ms

==================================================
  Scalability: Brute-Force vs Hungarian
==================================================

[Figure saved as team_formation.png]

All done! ✓

Key Takeaways

The assignment problem is a fundamental building block in scheduling, logistics, HR allocation, and competitive team drafting. The Hungarian algorithm gives you an exact optimal solution in polynomial time — there’s rarely a reason to use brute-force beyond $n \approx 8$. When you need additional business constraints (role restrictions, budget caps, skill prerequisites), ILP with PuLP is the natural upgrade path.