Marketing Analytics:RFM Customer Segmentation with Python Visualization

I’ll create a marketing analytics example using Python to analyze customer segmentation based on purchase behavior and create visualizations.

We’ll use the RFM (Recency, Frequency, Monetary) analysis, which is a common marketing technique.

1
2
3
4
5
6
7
8
9
10
11
12
13
14
15
16
17
18
19
20
21
22
23
24
25
26
27
28
29
30
31
32
33
34
35
36
37
38
39
40
41
42
43
44
45
46
47
48
49
50
51
52
53
54
55
56
57
58
59
60
61
62
63
64
65
66
67
68
69
70
71
72
73
74
75
76
77
78
79
80
81
82
83
84
85
86
87
88
89
90
91
92
93
94
95
96
97
98
99
100
101
102
103
104
105
106
107
108
109
110
111
112
113
114
115
116
import pandas as pd
import numpy as np
from datetime import datetime, timedelta
import matplotlib.pyplot as plt
import seaborn as sns

# Generate sample customer transaction data
np.random.seed(42)

# Create sample data
n_customers = 1000
customer_ids = range(1, n_customers + 1)

# Generate random dates within the last year
end_date = datetime(2025, 2, 21)
start_date = end_date - timedelta(days=365)
dates = [start_date + timedelta(days=np.random.randint(0, 365)) for _ in range(n_customers)]

# Generate random transaction amounts and frequencies
frequencies = np.random.poisson(lam=3, size=n_customers)
monetary_values = np.random.normal(100, 30, n_customers)
monetary_values = [max(20, val) for val in monetary_values] # Ensure minimum transaction value

# Create DataFrame
data = pd.DataFrame({
'customer_id': customer_ids,
'last_purchase_date': dates,
'purchase_frequency': frequencies,
'total_monetary_value': monetary_values
})

# Calculate RFM scores
current_date = end_date
data['recency'] = (current_date - pd.to_datetime(data['last_purchase_date'])).dt.days

# Function to assign RFM scores
def assign_score(value, quartiles):
if value <= quartiles[0.25]:
return 4
elif value <= quartiles[0.5]:
return 3
elif value <= quartiles[0.75]:
return 2
else:
return 1

# Calculate quartiles and assign scores
r_quartiles = data['recency'].quantile([0.25, 0.5, 0.75])
f_quartiles = data['purchase_frequency'].quantile([0.25, 0.5, 0.75])
m_quartiles = data['total_monetary_value'].quantile([0.25, 0.5, 0.75])

data['R_score'] = data['recency'].apply(lambda x: assign_score(x, r_quartiles))
data['F_score'] = data['purchase_frequency'].apply(lambda x: 5 - assign_score(x, f_quartiles))
data['M_score'] = data['total_monetary_value'].apply(lambda x: 5 - assign_score(x, m_quartiles))

# Calculate final RFM score
data['RFM_score'] = data['R_score'] * 100 + data['F_score'] * 10 + data['M_score']

# Segment customers based on RFM score
def segment_customers(row):
if row['RFM_score'] >= 444:
return 'Best Customers'
elif row['RFM_score'] >= 334:
return 'Loyal Customers'
elif row['RFM_score'] >= 224:
return 'Average Customers'
else:
return 'Lost Customers'

data['customer_segment'] = data.apply(segment_customers, axis=1)

# Create visualizations
plt.figure(figsize=(15, 10))

# Plot 1: Customer Segments Distribution
plt.subplot(2, 2, 1)
segment_counts = data['customer_segment'].value_counts()
plt.pie(segment_counts, labels=segment_counts.index, autopct='%1.1f%%')
plt.title('Customer Segments Distribution')

# Plot 2: Average Monetary Value by Segment
plt.subplot(2, 2, 2)
avg_monetary = data.groupby('customer_segment')['total_monetary_value'].mean()
avg_monetary.plot(kind='bar')
plt.title('Average Monetary Value by Segment')
plt.ylabel('Average Spend ($)')
plt.xticks(rotation=45)

# Plot 3: Recency vs Frequency
plt.subplot(2, 2, 3)
plt.scatter(data['recency'], data['purchase_frequency'],
c=data['total_monetary_value'], cmap='viridis')
plt.colorbar(label='Monetary Value ($)')
plt.xlabel('Recency (days)')
plt.ylabel('Purchase Frequency')
plt.title('Recency vs Frequency (color = Monetary Value)')

# Plot 4: RFM Score Distribution
plt.subplot(2, 2, 4)
plt.hist(data['RFM_score'], bins=20)
plt.xlabel('RFM Score')
plt.ylabel('Number of Customers')
plt.title('RFM Score Distribution')

plt.tight_layout()
plt.show()

# Print summary statistics
print("\nCustomer Segment Summary:")
print(data.groupby('customer_segment').agg({
'customer_id': 'count',
'total_monetary_value': 'mean',
'purchase_frequency': 'mean',
'recency': 'mean'
}).round(2))

Let me explain the code and analysis:

  1. Data Generation:

    • Created sample data for 1000 customers
    • Generated random purchase dates within the last year
    • Simulated purchase frequencies using Poisson distribution
    • Generated monetary values using normal distribution
  2. RFM Analysis:

    • Recency: Days since last purchase
    • Frequency: Number of purchases
    • Monetary: Total amount spent
    • Scored each component from 1-4 based on quartiles
    • Combined scores to create RFM_score
  3. Customer Segmentation:

    • Best Customers: Highest RFM scores
    • Loyal Customers: Good RFM scores
    • Average Customers: Medium RFM scores
    • Lost Customers: Low RFM scores
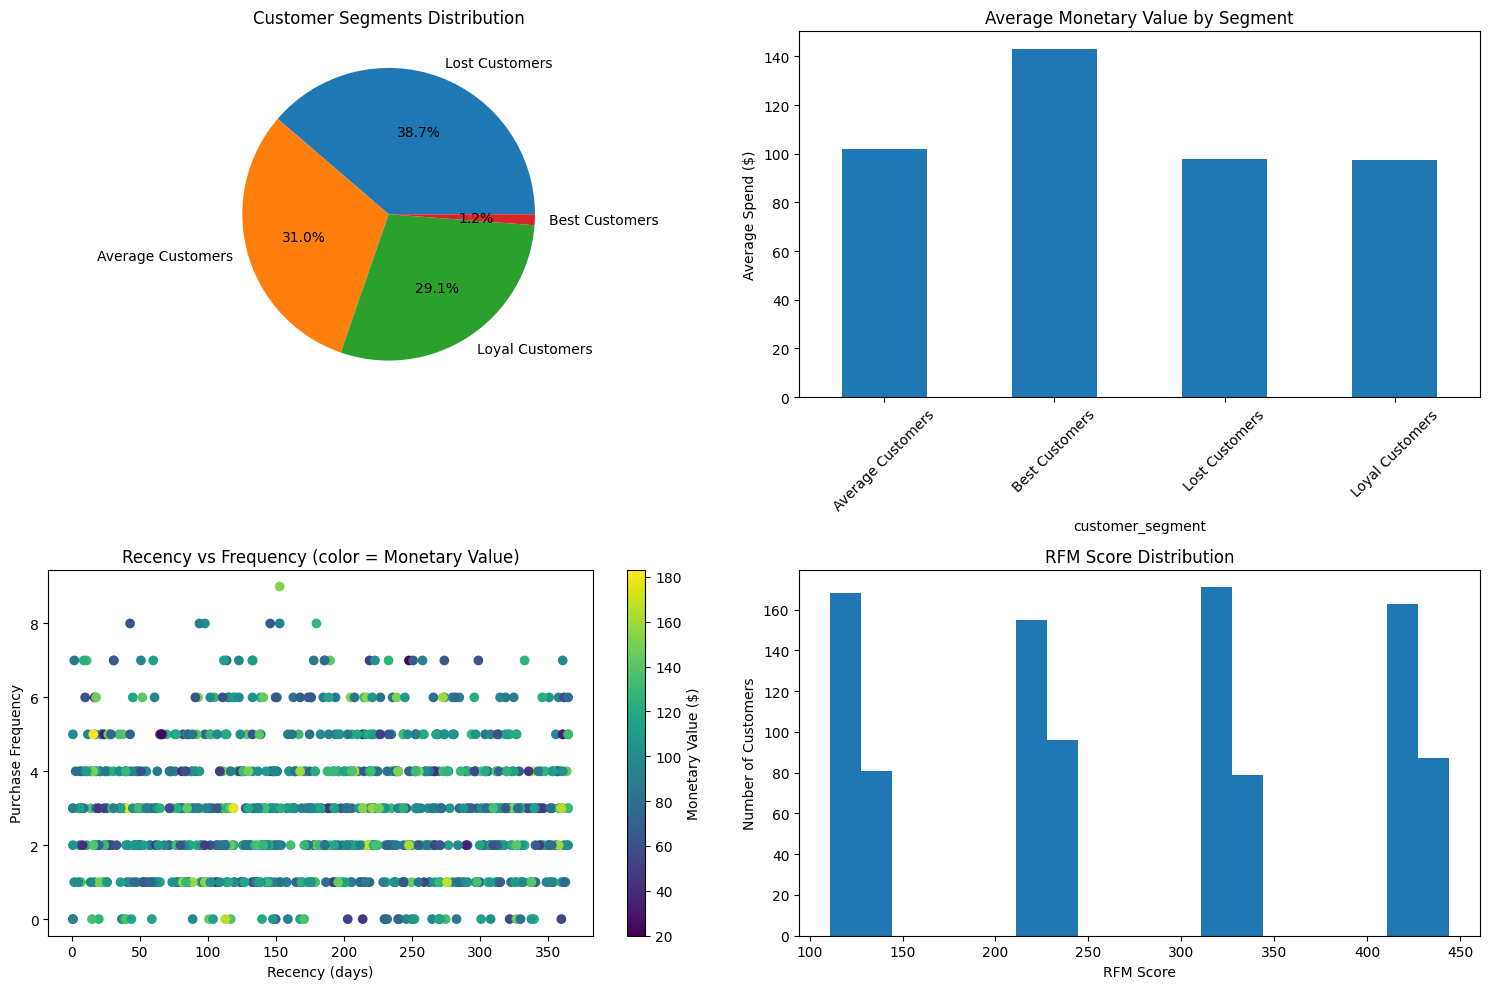
  4. Visualizations:

    • Pie chart showing distribution of customer segments
    • Bar chart showing average spend by segment
    • Scatter plot of recency vs frequency
    • Histogram of RFM scores

Output

Customer Segment Summary:
                   customer_id  total_monetary_value  purchase_frequency  \
customer_segment                                                           
Average Customers          310                101.87                3.07   
Best Customers              12                143.16                5.58   
Lost Customers             387                 97.72                2.52   
Loyal Customers            291                 97.65                3.38   

                   recency  
customer_segment            
Average Customers   172.13  
Best Customers       40.75  
Lost Customers      286.34  
Loyal Customers      64.54  

The analysis provides several key insights:

  1. Customer segment distribution shows the proportion of customers in each category
  2. Average monetary value by segment helps identify high-value customer groups
  3. Recency vs Frequency plot reveals customer purchase patterns
  4. RFM Score distribution shows the overall spread of customer values