1
2
3
4
5
6
7
8
9
10
11
12
13
14
15
16
17
18
19
20
21
22
23
24
25
26
27
28
29
30
31
32
33
34
35
36
37
38
39
40
41
42
43
44
45
46
47
48
49
50
51
52
53
54
55
56
57
58
59
60
61
62
63
64
65
66
67
68
69
70
71
72
73
74
75
76
77
78
79
80
81
82
83
84
85
86
87
88
89
90
91
92
93
94
95
96
97
98
99
100
101
102
103
104
105
106
107
108
109
110
111
112
113
114
115
116
117
118
119
120
121
122
123
124
125
126
127
128
| import numpy as np
import matplotlib.pyplot as plt
from scipy.optimize import fsolve
class PipeFlowAnalyzer:
def __init__(self):
self.density = 998.2
self.viscosity = 0.001
self.length = 10.0
self.diameter = 0.05
self.roughness = 0.0015
def reynolds_number(self, velocity):
"""Calculate Reynolds number"""
return self.density * velocity * self.diameter / self.viscosity
def friction_factor(self, reynolds):
"""
Calculate Darcy friction factor using Colebrook-White equation
"""
def colebrook(f):
return (1/np.sqrt(f) + 2.0*np.log10(self.roughness/(3.7*self.diameter*1000) +
2.51/(reynolds*np.sqrt(f))))
if reynolds < 2300:
return 64/reynolds
else:
f_0 = 0.25/(np.log10(self.roughness/(3.7*self.diameter*1000) + 5.74/reynolds**0.9)**2)
return fsolve(colebrook, f_0)[0]
def pressure_drop(self, velocity):
"""Calculate pressure drop using Darcy-Weisbach equation"""
re = self.reynolds_number(velocity)
f = self.friction_factor(re)
return (f * self.length * self.density * velocity**2) / (2 * self.diameter)
def velocity_profile(self, flow_rate, r_points=50):
"""Calculate velocity profile for laminar flow"""
radius = self.diameter/2
r = np.linspace(0, radius, r_points)
v_max = 2 * flow_rate / (np.pi * radius**2)
v = v_max * (1 - (r/radius)**2)
return r, v
def analyze_flow_range(self, velocities):
"""Analyze flow characteristics over a range of velocities"""
reynolds = [self.reynolds_number(v) for v in velocities]
pressure_drops = [self.pressure_drop(v) for v in velocities]
friction_factors = [self.friction_factor(re) for re in reynolds]
return reynolds, pressure_drops, friction_factors
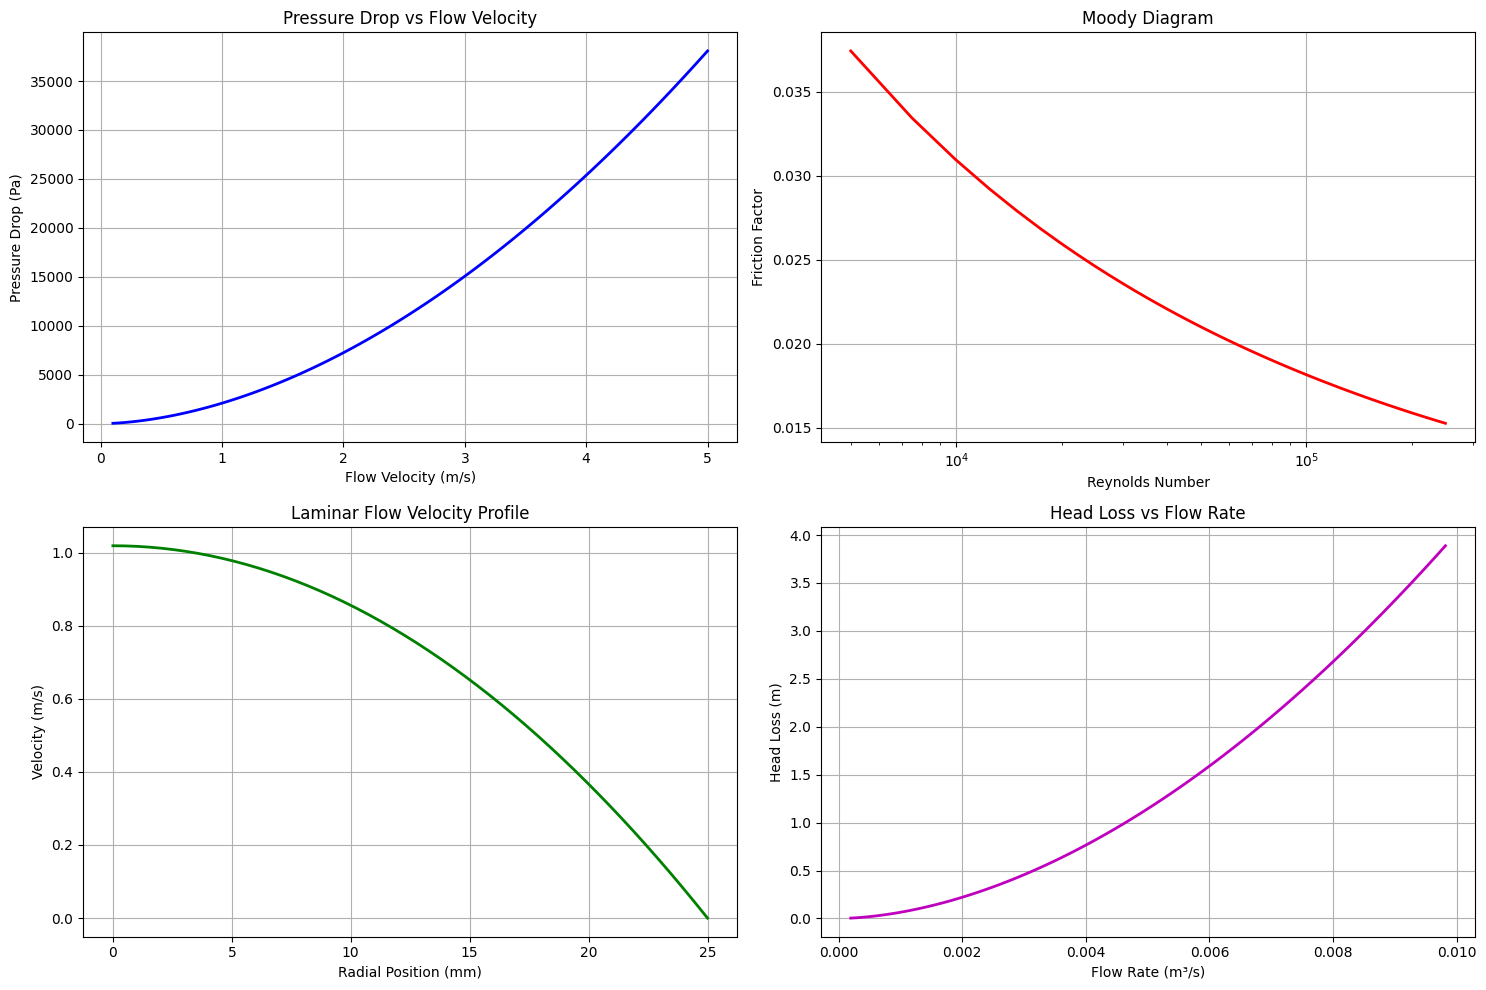
def plot_analysis(self, velocities):
"""Create visualizations of flow analysis"""
reynolds, pressure_drops, friction_factors = self.analyze_flow_range(velocities)
fig = plt.figure(figsize=(15, 10))
ax1 = fig.add_subplot(221)
ax1.plot(velocities, pressure_drops, 'b-', linewidth=2)
ax1.set_xlabel('Flow Velocity (m/s)')
ax1.set_ylabel('Pressure Drop (Pa)')
ax1.set_title('Pressure Drop vs Flow Velocity')
ax1.grid(True)
ax2 = fig.add_subplot(222)
ax2.semilogx(reynolds, friction_factors, 'r-', linewidth=2)
ax2.set_xlabel('Reynolds Number')
ax2.set_ylabel('Friction Factor')
ax2.set_title('Moody Diagram')
ax2.grid(True)
ax3 = fig.add_subplot(223)
flow_rate = 0.001
r, v = self.velocity_profile(flow_rate)
ax3.plot(r*1000, v, 'g-', linewidth=2)
ax3.set_xlabel('Radial Position (mm)')
ax3.set_ylabel('Velocity (m/s)')
ax3.set_title('Laminar Flow Velocity Profile')
ax3.grid(True)
ax4 = fig.add_subplot(224)
head_losses = [dp/(self.density * 9.81) for dp in pressure_drops]
flow_rates = [v * np.pi * (self.diameter/2)**2 for v in velocities]
ax4.plot(flow_rates, head_losses, 'm-', linewidth=2)
ax4.set_xlabel('Flow Rate (m³/s)')
ax4.set_ylabel('Head Loss (m)')
ax4.set_title('Head Loss vs Flow Rate')
ax4.grid(True)
plt.tight_layout()
return fig
analyzer = PipeFlowAnalyzer()
velocities = np.linspace(0.1, 5, 100)
analyzer.plot_analysis(velocities)
test_velocity = 1.0
re = analyzer.reynolds_number(test_velocity)
dp = analyzer.pressure_drop(test_velocity)
f = analyzer.friction_factor(re)
print("Pipe Flow Analysis Results:")
print(f"\nTest conditions at velocity = {test_velocity} m/s:")
print(f"Reynolds Number: {re:.0f}")
print(f"Flow Regime: {'Laminar' if re < 2300 else 'Turbulent'}")
print(f"Friction Factor: {f:.4f}")
print(f"Pressure Drop: {dp/1000:.2f} kPa")
print(f"Head Loss: {dp/(analyzer.density * 9.81):.2f} m")
|
