Creating Various 3D Plots in Python with Matplotlib
Here are various examples of $3D$ $plots$ using $Python$’s $Matplotlib$ library.
These examples demonstrate how to create different types of 3D graphs, including surface plots, scatter plots, and wireframe plots.
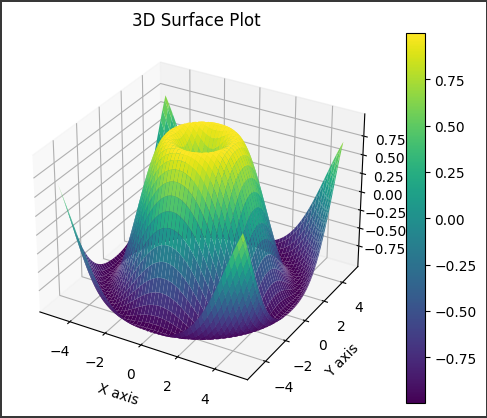
Example 1: 3D Surface Plot
A $surface$ $plot$ is useful for visualizing a 3D surface.
Let’s plot the function:
$$
z = \sin(\sqrt{x^2 + y^2})
$$
Python Code:
1
2
3
4
5
6
7
8
9
10
11
12
13
14
15
16
17
18
19
20
21
22
23
24
25
26
27
| import numpy as np
import matplotlib.pyplot as plt
from mpl_toolkits.mplot3d import Axes3D
x = np.linspace(-5, 5, 100)
y = np.linspace(-5, 5, 100)
x, y = np.meshgrid(x, y)
z = np.sin(np.sqrt(x**2 + y**2))
fig = plt.figure()
ax = fig.add_subplot(111, projection='3d')
surf = ax.plot_surface(x, y, z, cmap='viridis')
fig.colorbar(surf)
ax.set_xlabel('X axis')
ax.set_ylabel('Y axis')
ax.set_zlabel('Z axis')
plt.title("3D Surface Plot")
plt.show()
|
Output:
Example 2: 3D Scatter Plot
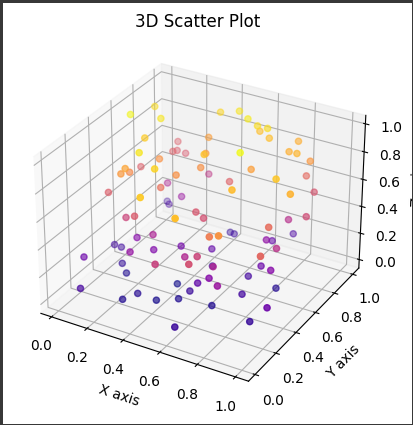
A $3D$ $scatter$ $plot$ is useful for visualizing data points in three dimensions.
Python Code:
1
2
3
4
5
6
7
8
9
10
11
12
13
14
15
16
17
18
19
|
x = np.random.rand(100)
y = np.random.rand(100)
z = np.random.rand(100)
fig = plt.figure()
ax = fig.add_subplot(111, projection='3d')
ax.scatter(x, y, z, c=z, cmap='plasma')
ax.set_xlabel('X axis')
ax.set_ylabel('Y axis')
ax.set_zlabel('Z axis')
plt.title("3D Scatter Plot")
plt.show()
|
Output:
Example 3: 3D Wireframe Plot
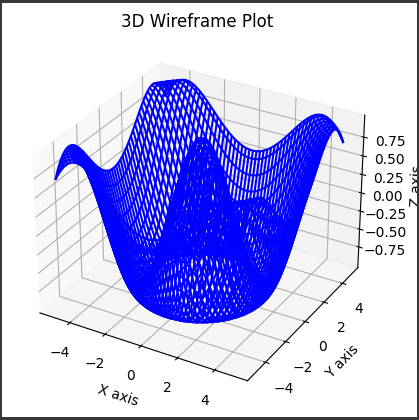
A $wireframe$ $plot$ shows the structure of a 3D surface using lines instead of a solid surface.
Python Code:
1
2
3
4
5
6
7
8
9
10
11
12
13
14
15
16
17
18
19
20
|
x = np.linspace(-5, 5, 100)
y = np.linspace(-5, 5, 100)
x, y = np.meshgrid(x, y)
z = np.cos(np.sqrt(x**2 + y**2))
fig = plt.figure()
ax = fig.add_subplot(111, projection='3d')
ax.plot_wireframe(x, y, z, color='blue')
ax.set_xlabel('X axis')
ax.set_ylabel('Y axis')
ax.set_zlabel('Z axis')
plt.title("3D Wireframe Plot")
plt.show()
|
Output:
Example 4: 3D Contour Plot
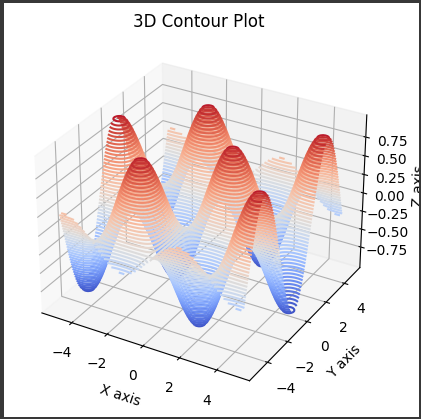
A $contour$ $plot$ in 3D shows contour lines (constant values) of a 3D surface.
Python Code:
1
2
3
4
5
6
7
8
9
10
11
12
13
14
15
16
17
18
19
20
|
x = np.linspace(-5, 5, 100)
y = np.linspace(-5, 5, 100)
x, y = np.meshgrid(x, y)
z = np.sin(x) * np.cos(y)
fig = plt.figure()
ax = fig.add_subplot(111, projection='3d')
ax.contour3D(x, y, z, 50, cmap='coolwarm')
ax.set_xlabel('X axis')
ax.set_ylabel('Y axis')
ax.set_zlabel('Z axis')
plt.title("3D Contour Plot")
plt.show()
|
Output:
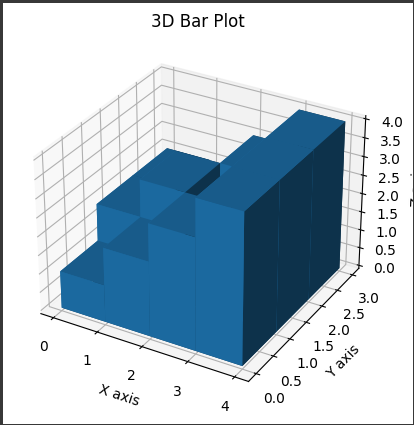
Example 5: 3D Bar Plot
A $3D$ $bar$ $plot$ is useful for displaying data across three axes.
Python Code:
1
2
3
4
5
6
7
8
9
10
11
12
13
14
15
16
17
18
19
20
21
22
23
24
|
_x = np.arange(4)
_y = np.arange(3)
_xx, _yy = np.meshgrid(_x, _y)
x, y = _xx.ravel(), _yy.ravel()
z = np.zeros_like(x)
dz = [1, 2, 3, 4, 2, 3, 1, 4, 2, 1, 3, 4]
fig = plt.figure()
ax = fig.add_subplot(111, projection='3d')
ax.bar3d(x, y, z, 1, 1, dz, shade=True)
ax.set_xlabel('X axis')
ax.set_ylabel('Y axis')
ax.set_zlabel('Z axis')
plt.title("3D Bar Plot")
plt.show()
|
Output:
Conclusion
These examples show how to create various types of $3D$ $plots$ in $Python$ using $Matplotlib$.
You can customize these plots further by adjusting parameters like colors, axes labels, and grid points.
$3D$ $plotting$ is a powerful way to visualize complex data and mathematical functions in $Python$.


