1
2
3
4
5
6
7
8
9
10
11
12
13
14
15
16
17
18
19
20
21
22
23
24
25
26
27
28
29
30
31
32
33
34
35
36
37
38
39
40
41
42
43
44
45
46
47
48
49
50
51
52
53
54
55
56
57
58
59
60
61
62
63
64
65
66
67
68
69
70
71
72
73
74
75
76
77
78
79
80
81
82
83
84
85
86
87
88
89
90
91
92
93
94
95
96
97
98
99
| import os, gym
import datetime
import gym_anytrading
import matplotlib.pyplot as plt
from gym_anytrading.envs import TradingEnv, ForexEnv, StocksEnv, Actions, Positions
from gym_anytrading.datasets import FOREX_EURUSD_1H_ASK, STOCKS_GOOGL
from stable_baselines.common.vec_env import DummyVecEnv
from stable_baselines import PPO2
from stable_baselines import ACKTR
from stable_baselines.bench import Monitor
from stable_baselines.common import set_global_seeds
import numpy as np
import matplotlib.pyplot as plt
# 勝敗をカウントする
def count(lst):
cnt_win = 0
cnt_lose = 0
for x in lst:
if x > 0:
cnt_win += 1
else:
cnt_lose += 1
return cnt_win, cnt_lose
def simulation(i, prm):
global means
# ログフォルダの生成
log_dir = './logs/'
os.makedirs(log_dir, exist_ok=True)
# 環境の生成
env = gym.make('forex-v0', frame_bound=(prm['start_idx'],
prm['end_idx']),
window_size = prm['window_size'])
env = Monitor(env, log_dir, allow_early_resets=True)
# シードの指定
env.seed(0)
set_global_seeds(0)
# ベクトル化環境の生成
env = DummyVecEnv([lambda: env])
# モデルの読み込み
# model = PPO2.load('model{}'.format(i))
model = ACKTR.load('model{}'.format(i))
# モデルのテスト
env = gym.make('forex-v0', frame_bound=(prm['start_idx'] + prm['move_idx'],
prm['end_idx'] + prm['move_idx']),
window_size = prm['window_size'])
env.seed(0)
state = env.reset()
while True:
# 行動の取得
action, _ = model.predict(state) # 0 or 1
# 1ステップ実行
state, reward, done, info = env.step(action)
# エピソード完了
if done:
print('info:', info, info['total_reward']) # info: {'total_reward': 8610370000.0, 'total_profit': 1.7844206334206751, 'position': 1} 8610370000.0
means.append(info['total_reward'])
break
# グラフのプロット
plt.cla()
env.render_all()
cnt_win = 0
cnt_lose = 0
for move_idx in range(0, 801, 50):
labels = []
means = []
prm = {'window_size': 10, #window_size 参照すべき直前のデータ数
'start_idx' : 10, #start_idx 学習データの開始位置
'end_idx' : 510, #end_idx 学習データの終了位置
'move_idx' : move_idx} #学習データからの移動分。移動したものを検証データとする。
for i in range(30):
labels.append('{}'.format(i))
simulation(4, prm)
x = np.arange(len(labels))
width = 0.35
fig, ax = plt.subplots()
rect = ax.bar(x, means, width)
ax.set_xticks(x)
ax.set_xticklabels(labels)
#print(means, np.average(means), count(means))
cnt = count(means)
plt.title('[Average]{:,.0f} [Win]{} [Lose]{}'.format(np.average(means), cnt[0], cnt[1]))
plt.savefig('trading{:03d}.png'.format(move_idx))
if cnt[0] > cnt[1]:
cnt_win += 1
else:
cnt_lose += 1
print('{}勝 {}敗'.format(cnt_win, cnt_lose))
|
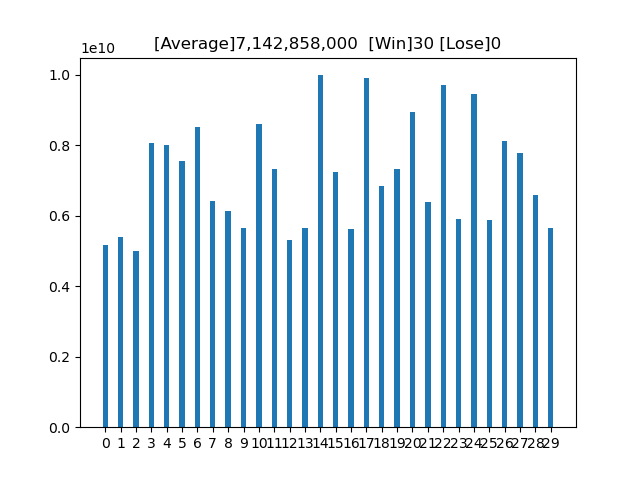 0日移動
0日移動
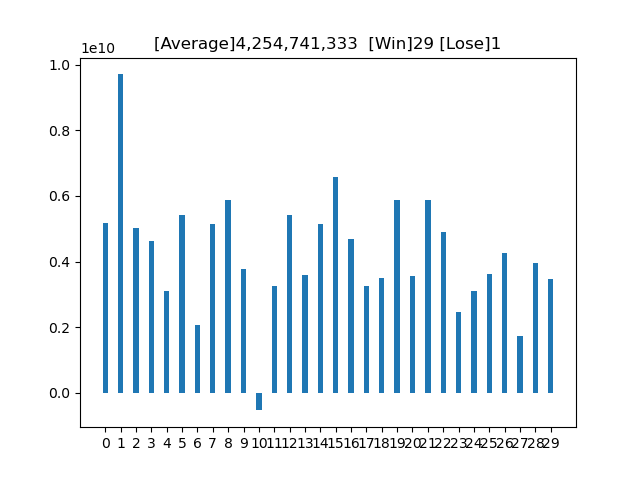 50日移動
50日移動
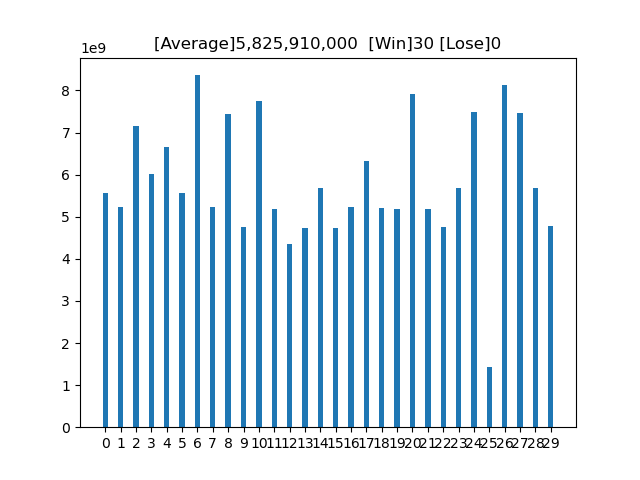 100日移動
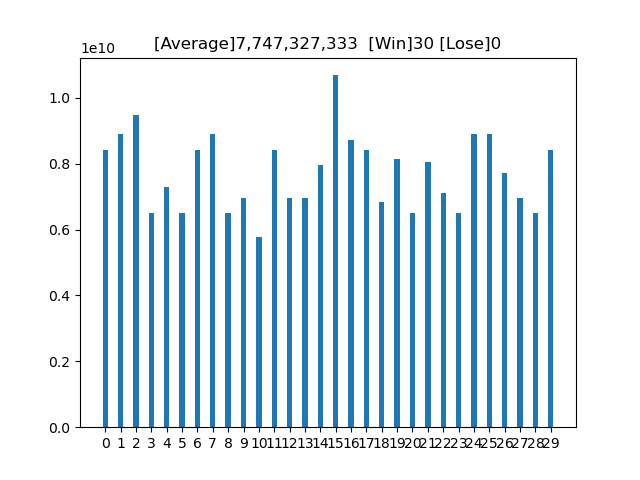 150日移動
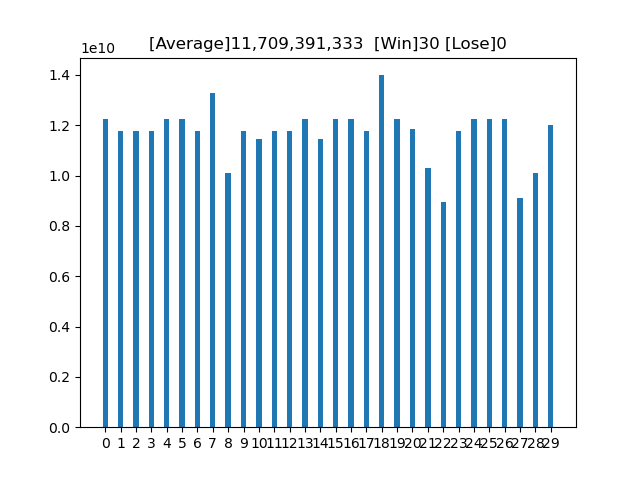 200日移動
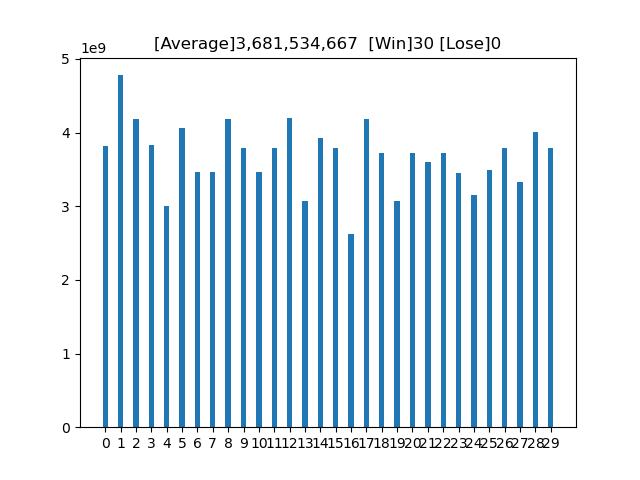 250日移動
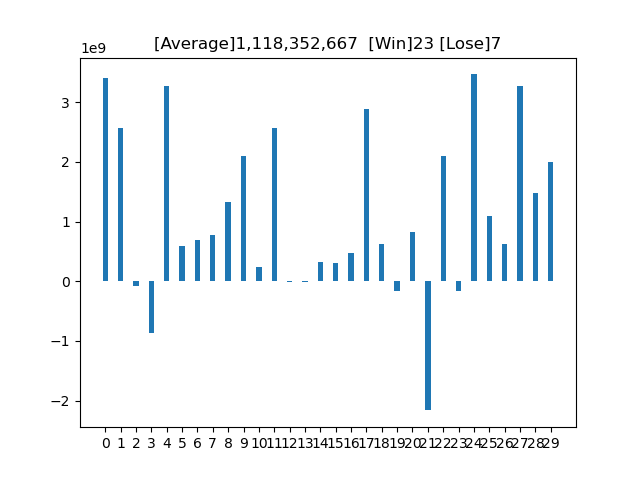 300日移動
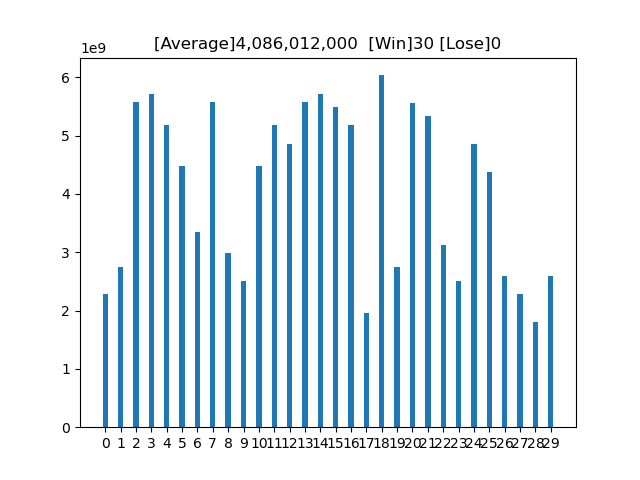 350日移動
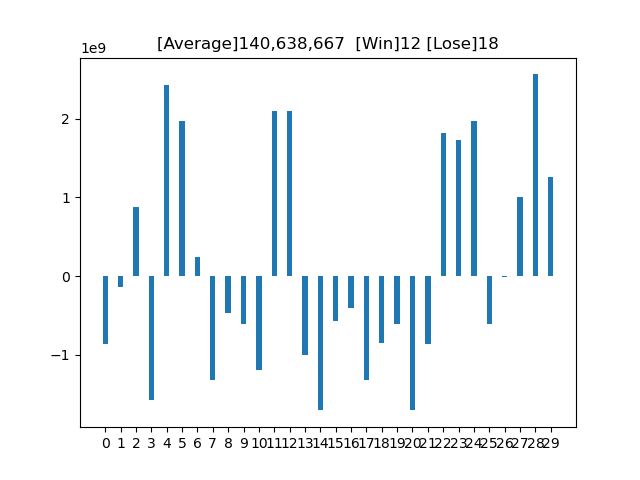 400日移動
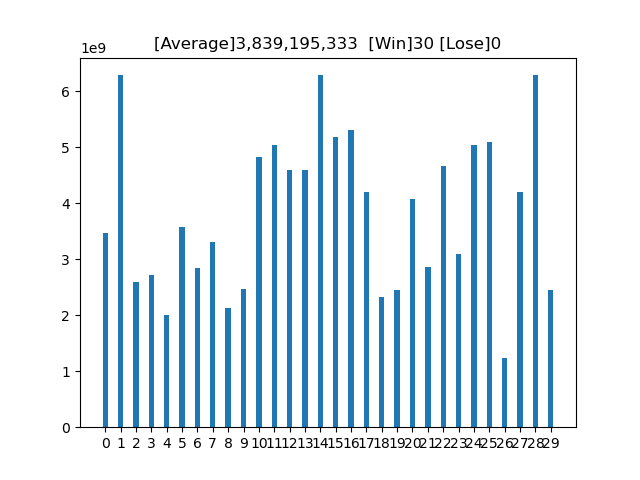 450日移動
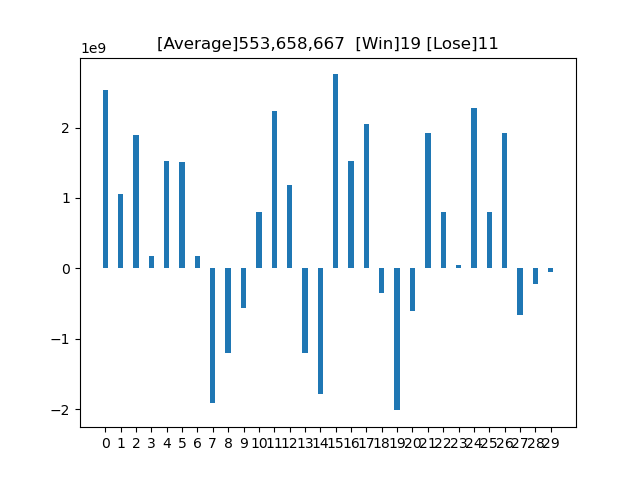 500日移動
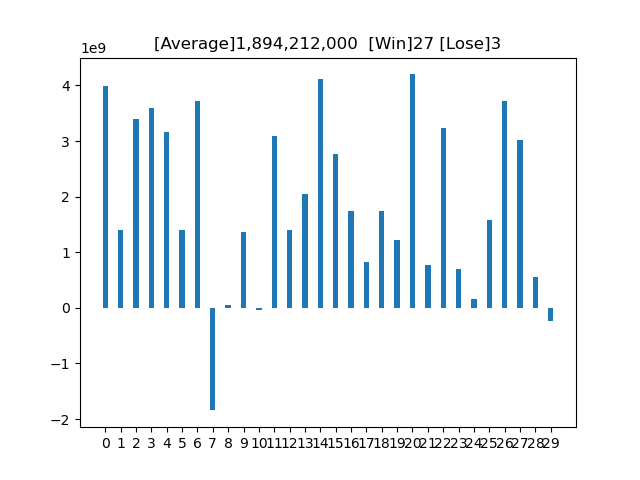 550日移動
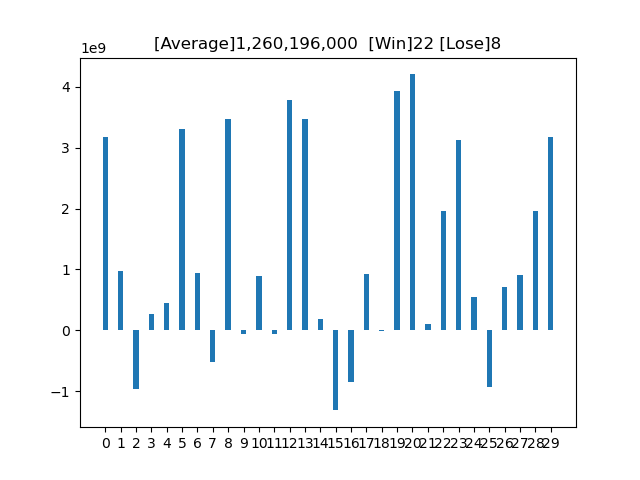 600日移動
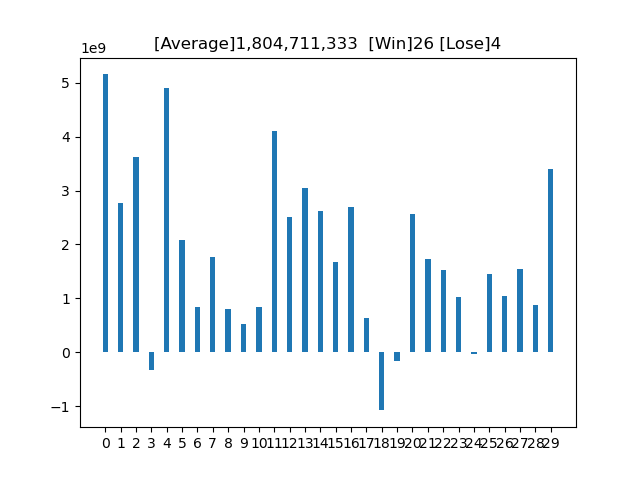 650日移動
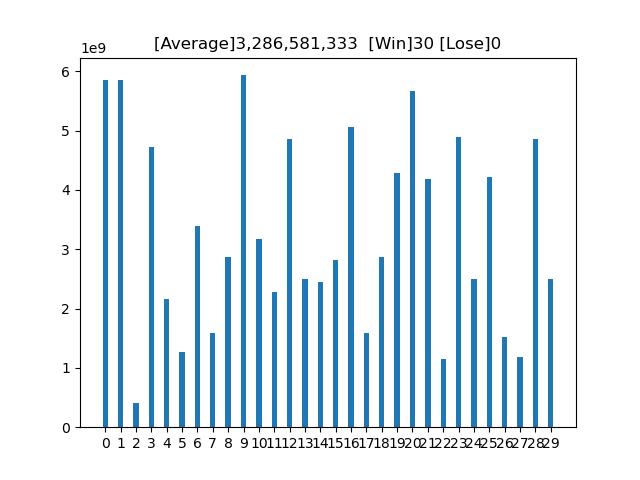 700日移動
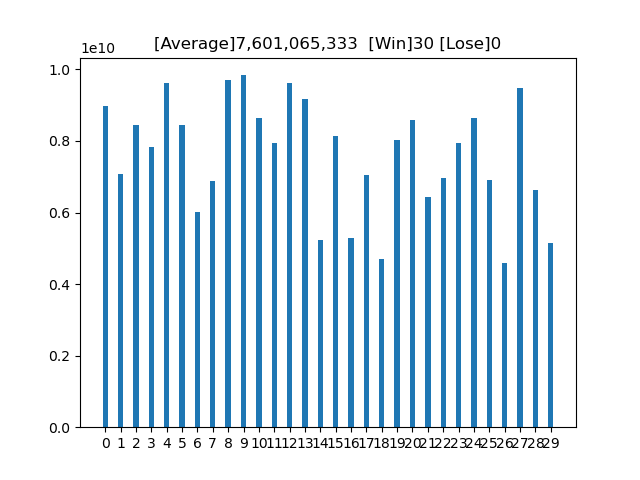 750日移動
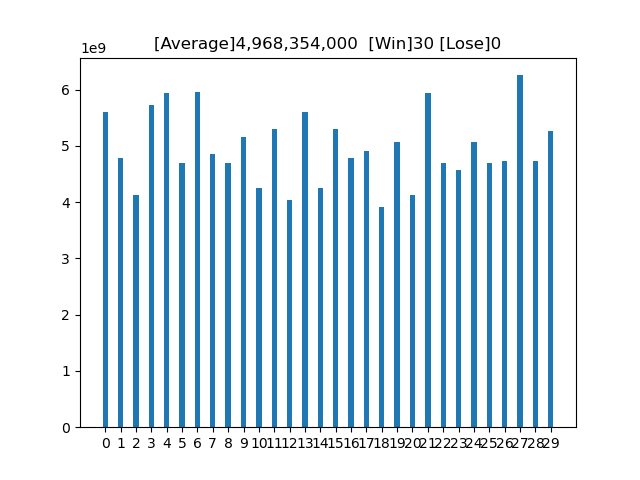 800日移動