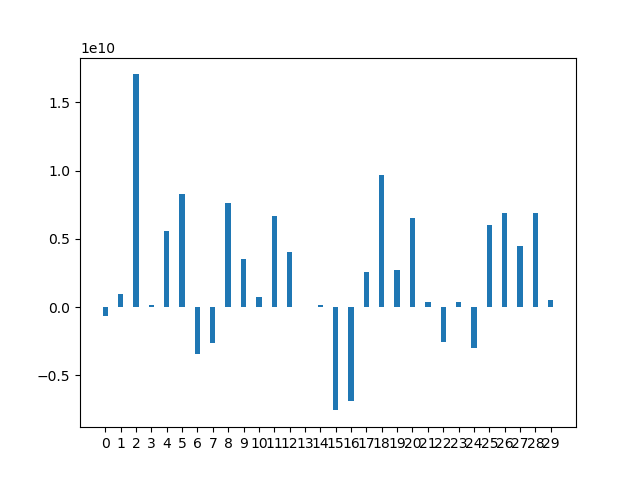
1
2
3
4
5
6
7
8
9
10
11
12
13
14
15
16
17
18
19
20
21
22
23
24
25
26
27
28
29
30
31
32
33
34
35
36
37
38
39
40
41
42
43
44
45
46
47
48
49
50
51
52
53
54
55
56
57
58
59
60
61
62
63
64
65
66
67
68
69
70
71
72
73
74
75
76
77
78
79
80
81
82
83
84
85
86
87
88
89
90
91
92
93
94
95
96
97
98
99
100
101
102
103
104
| import os, gym
import datetime
import gym_anytrading
import matplotlib.pyplot as plt
from gym_anytrading.envs import TradingEnv, ForexEnv, StocksEnv, Actions, Positions
from gym_anytrading.datasets import FOREX_EURUSD_1H_ASK, STOCKS_GOOGL
from stable_baselines.common.vec_env import DummyVecEnv
from stable_baselines import PPO2
from stable_baselines import ACKTR
from stable_baselines.bench import Monitor
from stable_baselines.common import set_global_seeds
import numpy as np
import matplotlib.pyplot as plt
def simulation(i):
global means
# ログフォルダの生成
log_dir = './logs/'
os.makedirs(log_dir, exist_ok=True)
# [20] 2020-06-28 10:00
idx1 = 50
#
idx2 = 350
# データ数
span = idx2 - idx1
# 環境の生成
env = gym.make('forex-v0', frame_bound=(idx1, idx2), window_size=20)
env = Monitor(env, log_dir, allow_early_resets=True)
# シードの指定
env.seed(0)
set_global_seeds(0)
# ベクトル化環境の生成
env = DummyVecEnv([lambda: env])
# モデルの生成
model = PPO2('MlpPolicy', env, verbose=1)
#model = ACKTR('MlpPolicy', env, verbose=1)
# モデルの読み込み
model = PPO2.load('trading_model{}'.format(i))
# モデルの学習
#model.learn(total_timesteps=128000)
# モデルの保存
#model.save('trading_model{}'.format(i))
# モデルのテスト
env = gym.make('forex-v0', frame_bound=(idx2+500, idx2 + span+500), window_size=20)
env.seed(0)
state = env.reset()
while True:
# 行動の取得
action, _ = model.predict(state)
# 1ステップ実行
state, reward, done, info = env.step(action)
# エピソード完了
if done:
print('info:', info, info['total_reward'])
means.append(info['total_reward'])
break
# グラフのプロット
plt.cla()
env.render_all()
plt.savefig('trading{:%Y%m%d_%H%M%S}.png'.format(datetime.datetime.now()))
#plt.show()
with open('C:/Util/Anaconda3/Lib/site-packages/gym_anytrading/datasets/data/FOREX_EURUSD_1H_ASK.csv', 'r') as f:
lines = f.readlines()
s1 = lines[idx1].split(',')[0]
s2 = lines[idx2-1].split(',')[0]
#print(s1,s2, (idx2 - idx1))
s3 = lines[idx2].split(',')[0]
s4 = lines[idx2+span].split(',')[0]
#print(s3,s4, (idx2+span - idx2))
#for i in range(10):
# simulation(i)
#labels = ['label1', 'label2', 'label3', 'label4', 'label5']
#means = [20, 34, 30, 35, 27]
labels = []
means = []
for i in range(30):
labels.append('{}'.format(i))
simulation(2)
x = np.arange(len(labels))
width = 0.35
fig, ax = plt.subplots()
rect = ax.bar(x, means, width)
ax.set_xticks(x)
ax.set_xticklabels(labels)
plt.show()
|
