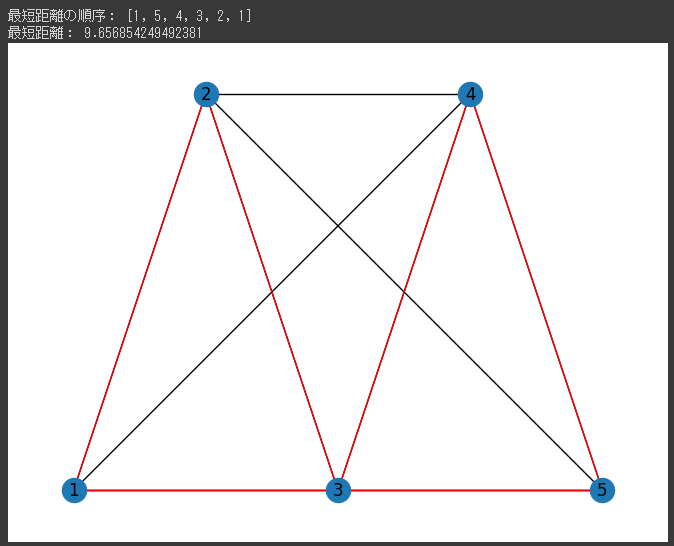
1
2
3
4
5
6
7
8
9
10
11
12
13
14
15
16
17
18
19
20
21
22
23
24
25
26
27
28
29
30
31
32
| import networkx as nx
import matplotlib.pyplot as plt
positions = {1: (0, 0), 2: (1, 1), 3: (2, 0), 4: (3, 1), 5: (4, 0)}
def distance(u, v):
x1, y1 = positions[u]
x2, y2 = positions[v]
return ((x1-x2)**2 + (y1-y2)**2)**0.5
G = nx.Graph()
G.add_nodes_from(positions.keys())
for u in positions:
for v in positions:
if u < v:
G.add_edge(u, v, weight=distance(u, v))
tsp = list(nx.algorithms.approximation.traveling_salesman_problem(G))
print("最短距離の順序:", tsp)
print("最短距離:", sum(distance(u, v) for u, v in zip(tsp, tsp[1:]+tsp[:1])))
pos = positions
nx.draw(G, pos=pos, with_labels=True)
nx.draw_networkx_edges(G, pos=pos, edgelist=[(u, v) for u, v in zip(tsp, tsp[1:]+tsp[:1])], edge_color='r')
plt.show()
|

