選択範囲の相互リンク
HoloViews では、選択範囲のデータを相互リンク することができます。
コールバック関数で定義する必要なく、グラフ間でデータ選択状態を自動的にリンク可能です。
実装手順は以下の通りです。
link_selections.instanceメソッド を使用して link_selections インスタンス (以下のソースコードでは selection_linker) を作成する。(15行目)このオブジェクトをリンクする要素 またはコンテナ を含む関数として呼び出す。(16~21行目)
リンクされた要素が to_dash 関数 に渡されると、Dash コールバックが自動的に生成 されインタラクティブなリンク動作を実現できます。
また、to_dash関数のreset_buttonオプション にTrue を設定することで、選択状態をリセットするためのボタンを表示することができます。(36行目)
[ソースコード]
1 2 3 4 5 6 7 8 9 10 11 12 13 14 15 16 17 18 19 20 21 22 23 24 25 26 27 28 29 30 31 32 33 34 35 36 37 38 39 40 41 42 import dashfrom dash import htmlfrom plotly.data import irisimport holoviews as hvfrom holoviews import optsfrom holoviews.plotting.plotly.dash import to_dashdf = iris() dataset = hv.Dataset(df) selection_linker = hv.selection.link_selections.instance() scatter = selection_linker( hv.Scatter(dataset, kdims=["sepal_length" ], vdims=["sepal_width" ]) ) hist = selection_linker( hv.operation.histogram(dataset, dimension="petal_width" , normed=False ) ) def set_dragmode (plot, element ): fig = plot.state fig['layout' ]['dragmode' ] = "select" if isinstance (element, hv.Histogram): fig['layout' ]['selectdirection' ] = "h" scatter.opts(opts.Scatter(hooks=[set_dragmode])) hist.opts(opts.Histogram(hooks=[set_dragmode])) app = dash.Dash(__name__) components = to_dash( app, [scatter, hist], reset_button=True ) app.layout = html.Div(components.children) if __name__ == "__main__" : app.run_server(debug=True )
[ブラウザで表示]
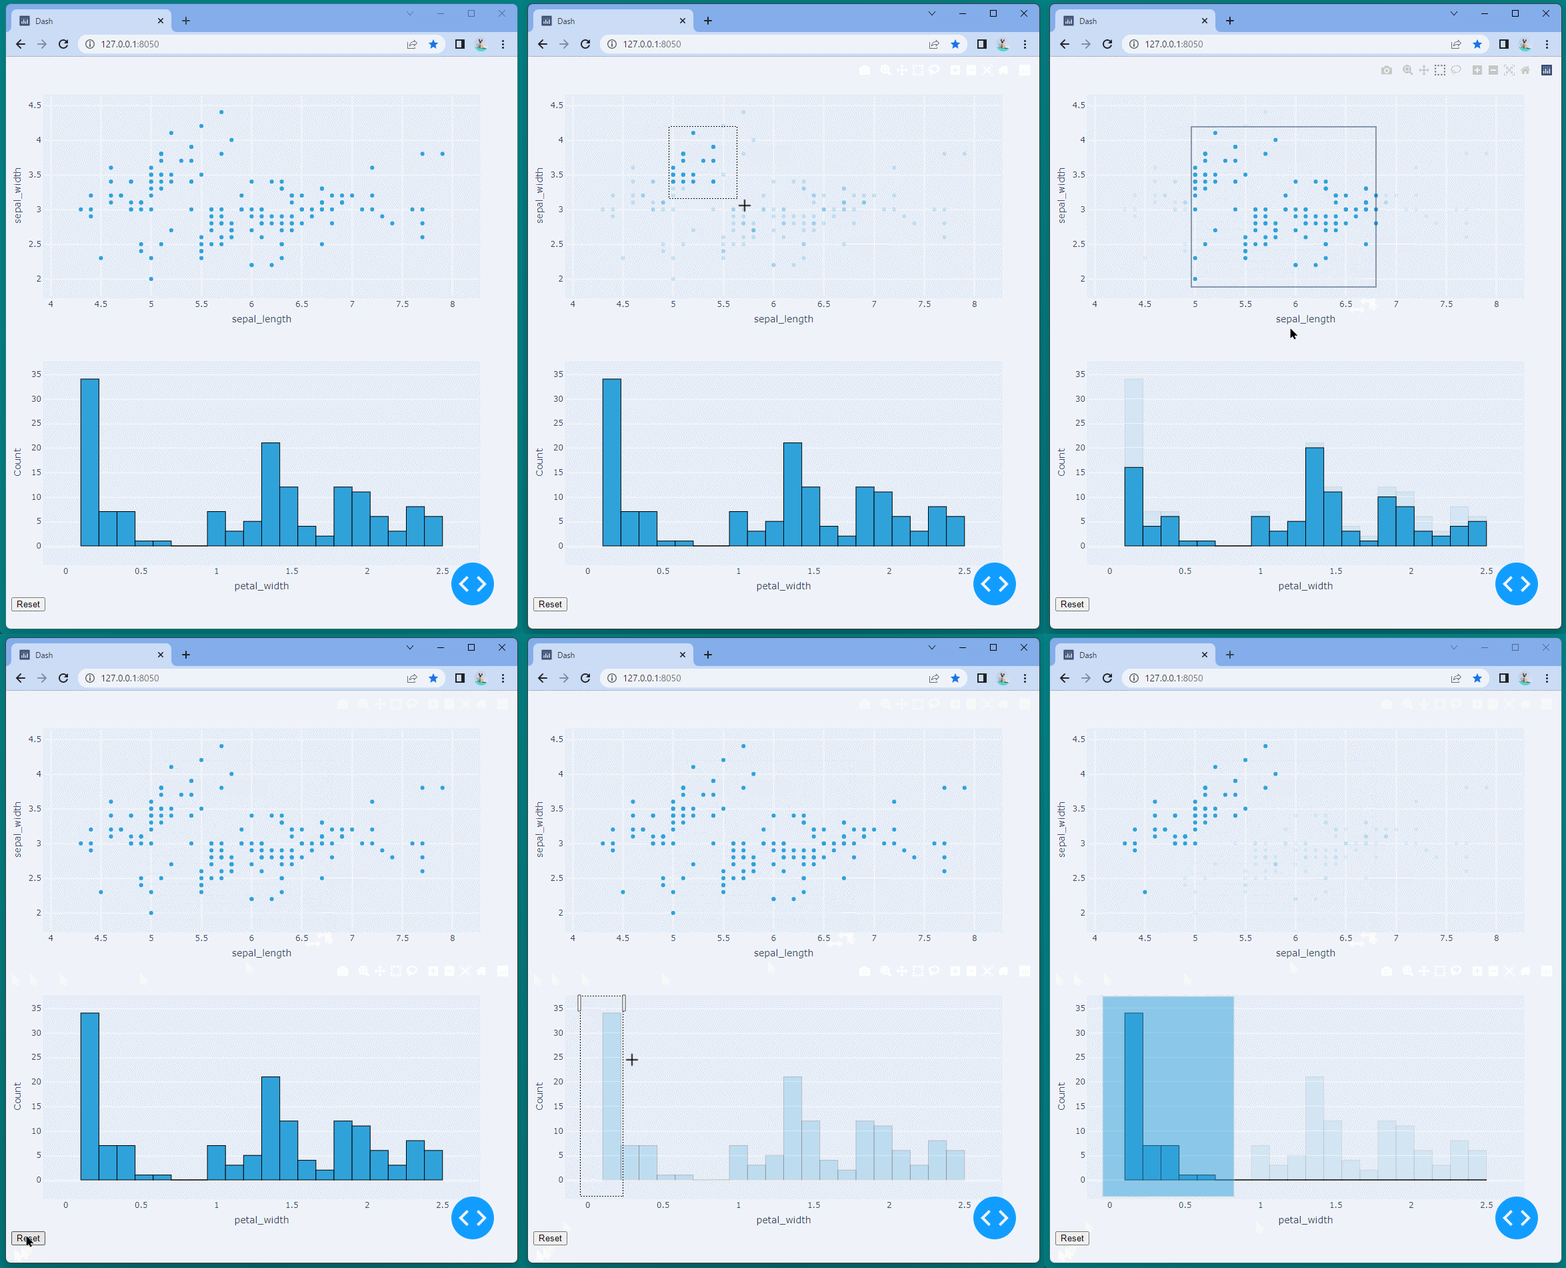
上図に散布図 、下図に棒グラフ が表示されました。
散布図 で特定の範囲を選択すると、その選択範囲に応じたデータが折れ線グラフ に反映されます。
折れ線グラフ で特定の範囲を選択した場合も、その選択範囲に応じたデータが散布図 に反映されます。
またresetボタン を押すことで、両グラフの選択状態をリセットできます。
