Dash㉓(画面遷移)

画面遷移

URLのリンクをクリックするとコンテンツが切り替わる(画面遷移する)Dashアプリケーションを作成します。

irisのデータセットを使用します。

レイアウトとしては以下の3つを配置します。

  • URLを生成するためのLocationコンポーネント
  • URLを切り替えるためのLinkコンポーネント
  • コンテンツを表示するDivコンポーネント

[ソースコード]

1
2
3
4
5
6
7
8
9
10
11
12
13
14
15
16
17
18
19
20
21
22
23
24
25
26
27
28
29
30
31
32
33
34
35
36
37
38
39
40
41
42
43
44
45
46
47
48
49
50
51
52
53
54
55
56
57
58
59
60
61
62
63
64
65
66
67
68
import dash
import dash_core_components as dcc
import dash_html_components as html
import plotly.express as px
import plotly.graph_objects as go
from dash.dependencies import Input, Output

iris = px.data.iris() # データの読み込み

app = dash.Dash(__name__) # Dashインスタンスを生成

app.layout = html.Div(
[
dcc.Location(id='location1'), # Locationコンポーネント
html.Br(),
dcc.Link('home', href='/'), # Linkコンポーネント
html.Br(),
dcc.Link('/graph', href='/graph'), # Linkコンポーネント
html.Br(),
dcc.Link('/table', href='/table'), # Linkコンポーネント
html.Br(),
html.Div( # Divコンポーネント
id='div1',
style={'fontSize':'40', 'textAlign':'center', 'height':350}
)
],
style={'fontSize':'40', 'textAlign':'center'}
)

# ページごとのコンテンツ作成
home = html.H1('irisデータ')

graph = dcc.Graph(
figure=px.scatter(
iris,
x='sepal_width',
y='sepal_length',
color='species',
title='irisグラフ'
)
)

table = dcc.Graph(
figure=go.Figure(
data=go.Table(
header={'values':iris.columns},
cells={'values':[iris[col].tolist() for col in iris.columns]}
),
layout=go.Layout(title='irisデータテーブル')
)
)

# コールバックの定義
@app.callback(
Output('div1', 'children'),
Input('location1', 'pathname')
)
def update_location(pathname):
# pathnameごとにコンテンツを返す
if pathname == '/graph':
return graph
elif pathname == '/table':
return table
else:
return home

if __name__ == '__main__':
app.run_server(debug=True) # アプリケーションを起動

各ページのコンテンツとしては、タイトル散布図テーブルを作成します。

コールバック関数では、作成したコンテンツを 引数 pathname ごとに返します。

[ブラウザで表示]
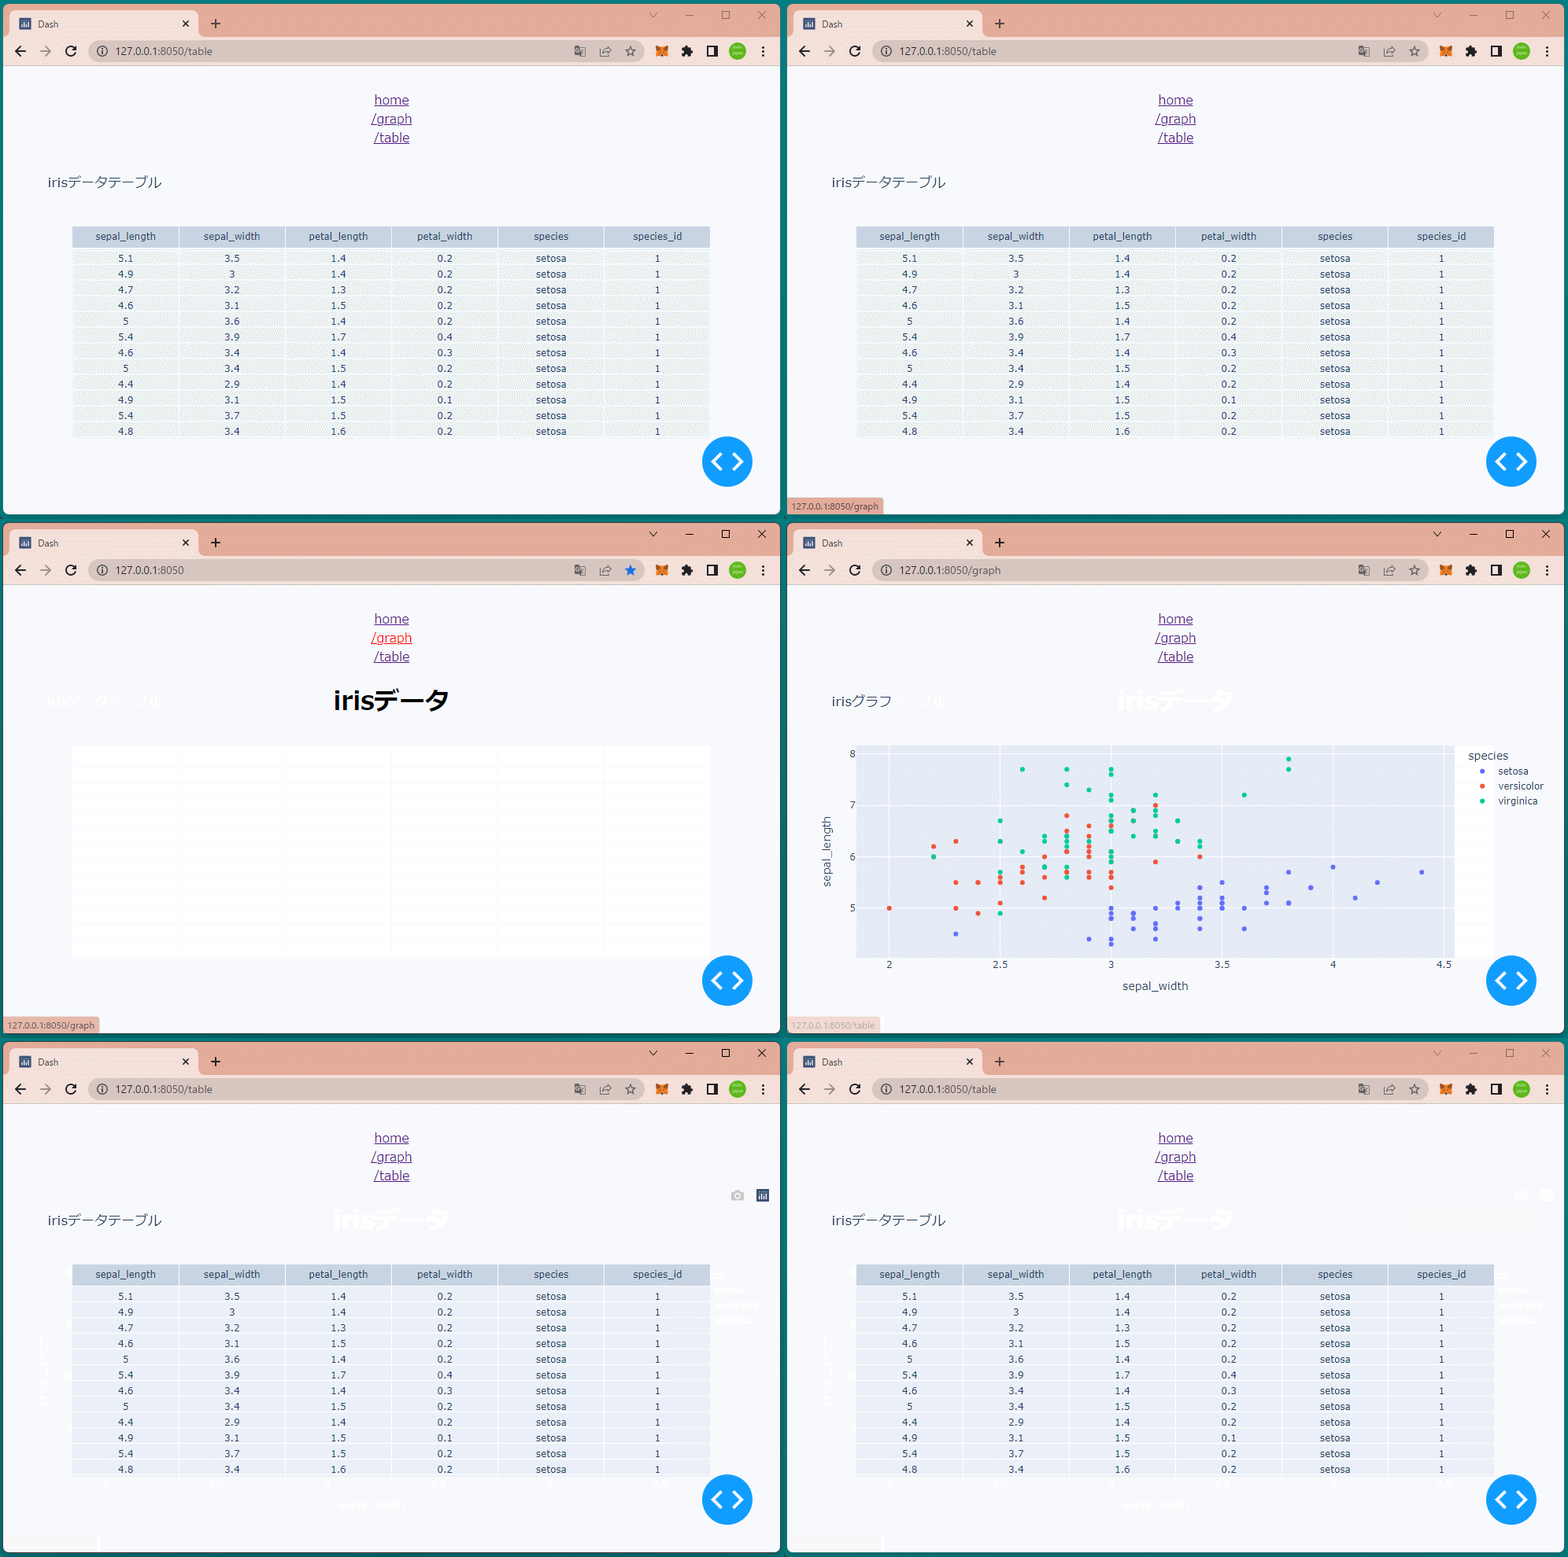
最初の画面としては、タイトルとリンクが並んだページが表示されます。

“/graph”をクリックするとグラフが表示され、“/table”をクリックするとテーブルが表示されるようになりました。