1
2
3
4
5
6
7
8
9
10
11
12
13
14
15
16
17
18
19
20
21
22
23
24
25
26
27
28
29
30
31
32
33
34
35
36
37
38
39
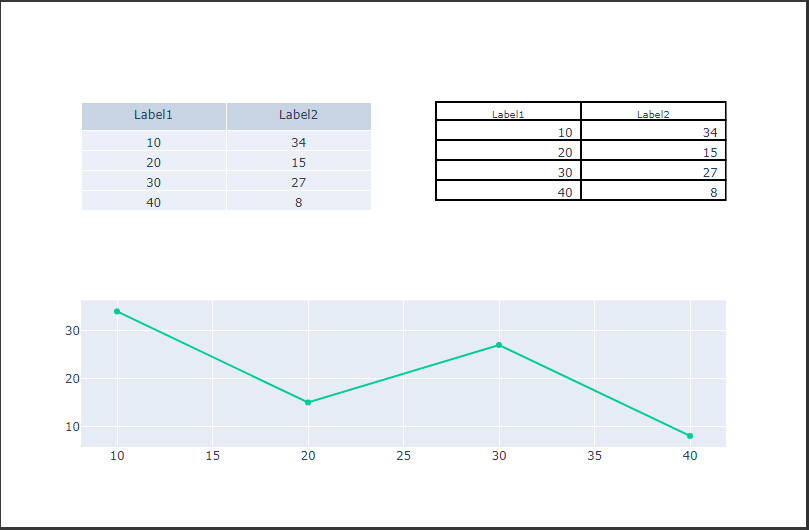
| import pandas as pd
import plotly.graph_objects as go
from plotly.subplots import make_subplots
table_values = [[10, 20, 30, 40], [34, 15, 27, 8]]
table_labels = ["Label1", "Label2"]
table_fig = make_subplots(
rows=2,
cols=2,
specs=[[{"type": "domain"}, {"type": "domain"}], [{"colspan": 2}, None]],
)
table_fig.add_trace(
go.Table(header={"values": table_labels}, cells={"values": table_values}),
row=1,
col=1,
)
table_fig.add_trace(
go.Table(
cells={
"values": pd.DataFrame(table_values),
"line": {"width": 2, "color": "black"},
"fill": {"color": "white"},
"align": "right",
},
header={
"values": table_labels,
"height": 18,
"line": {"width": 2, "color": "black"},
"fill": {"color": "white"},
"font": {"size": 10},
},
),
row=1,
col=2,
)
table_fig.add_trace(
go.Scatter(x=table_values[0], y=table_values[1]), row=2, col=1
)
table_fig.show()
|